9 Wingold St Fall River, MA 02720
Bank Street NeighborhoodEstimated Value: $472,000 - $648,000
About This Home
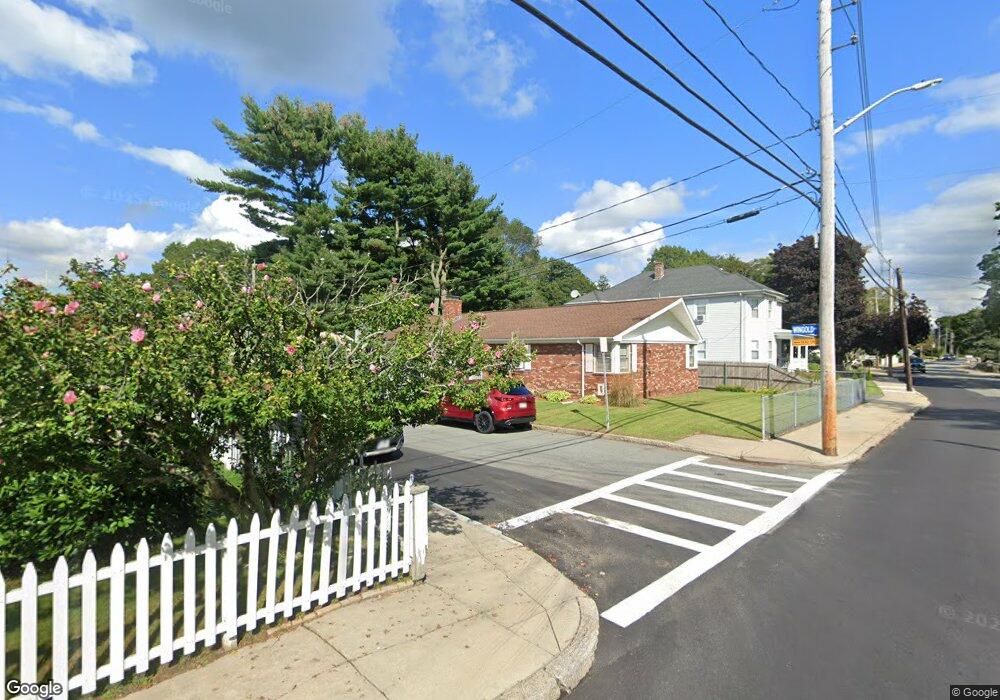
This home is located at 9 Wingold St, Fall River, MA 02720 and is currently estimated at $526,586, approximately $275 per square foot. 9 Wingold St is a home located in Bristol County with nearby schools including Spencer Borden Elementary School, Morton Middle School, and B M C Durfee High School.
Ownership History
We collect this data history from publicly available records. To have your information removed, we recommend requesting removal directly through your county’s website.
Purchase Details
Home Financials for this Owner
Home Financials are based on the most recent Mortgage that was taken out on this home.Home Values in the Area
Average Home Value in this Area
Purchase History
We collect this data history from publicly available records. To have your information removed, we recommend requesting removal directly through your county’s website.
| Date | Buyer | Sale Price | Title Company |
|---|---|---|---|
| $128,650 | -- |
Mortgage History
We collect this data history from publicly available records. To have your information removed, we recommend requesting removal directly through your county’s website.
| Date | Status | Borrower | Loan Amount |
|---|---|---|---|
| Open | $101,500 | ||
| Closed | $110,000 | ||
| Closed | $122,900 |
Tax History
We collect this data history from publicly available records. To have your information removed, we recommend requesting removal directly through your county’s website.
| Year | Tax Paid | Tax Assessment Tax Assessment Total Assessment is a certain percentage of the fair market value that is determined by local assessors to be the total taxable value of land and additions on the property. | Land | Improvement |
|---|---|---|---|---|
| 2025 | $3,930 | $343,200 | $132,700 | $210,500 |
| 2024 | $3,691 | $321,200 | $127,600 | $193,600 |
| 2023 | $3,571 | $291,000 | $114,500 | $176,500 |
| 2022 | $3,182 | $250,000 | $106,000 | $144,000 |
| 2021 | $3,182 | $230,100 | $100,100 | $130,000 |
| 2020 | $3,078 | $213,000 | $96,400 | $116,600 |
| 2019 | $2,995 | $205,400 | $96,400 | $109,000 |
| 2018 | $2,953 | $202,000 | $96,400 | $105,600 |
| 2017 | $2,803 | $200,200 | $96,400 | $103,800 |
| 2016 | $2,659 | $195,100 | $96,400 | $98,700 |
| 2015 | $2,509 | $191,800 | $90,100 | $101,700 |
| 2014 | $2,413 | $191,800 | $90,100 | $101,700 |
Map
- 28 Wingold St
- 1243 New Boston Rd
- 1163 New Boston Rd
- 891 N Eastern Ave
- 251 Rich St
- 106 David St
- 152 Harding St
- 1244 President Ave
- 235 Chavenson St
- 45 Beauregard St
- 70 Warburton St
- 65-67 Farnham St
- 435-437 Stetson St
- 435 Stetson St Unit 437
- 79 Woodlawn St
- 45 Read St
- 1443 Bedford St
- 1231 Robeson St
- 27 Johnson St
- 37 Shawmut St
- 1228 New Boston Rd
- 1220 New Boston Rd
- 1198 New Boston Rd
- 37 Wingold St
- 1248 New Boston Rd
- 1203 New Boston Rd
- 1225 New Boston Rd
- 38 Wingold St
- 47 Wingold St
- 1186 New Boston Rd Unit 1188
- 50 Wingold St
- 57 Wingold St
- 586 Freelove St
- 1166 New Boston Rd
- 951 N Eastern Ave
- 50 Celia St
- 40 Celia St
- 580 Freelove St
- 1270 New Boston Rd
- 60 Celia St
Ask me questions while you tour the home.