Estimated Value: $278,000 - $328,000
3
Beds
1
Bath
1,368
Sq Ft
$220/Sq Ft
Est. Value
About This Home
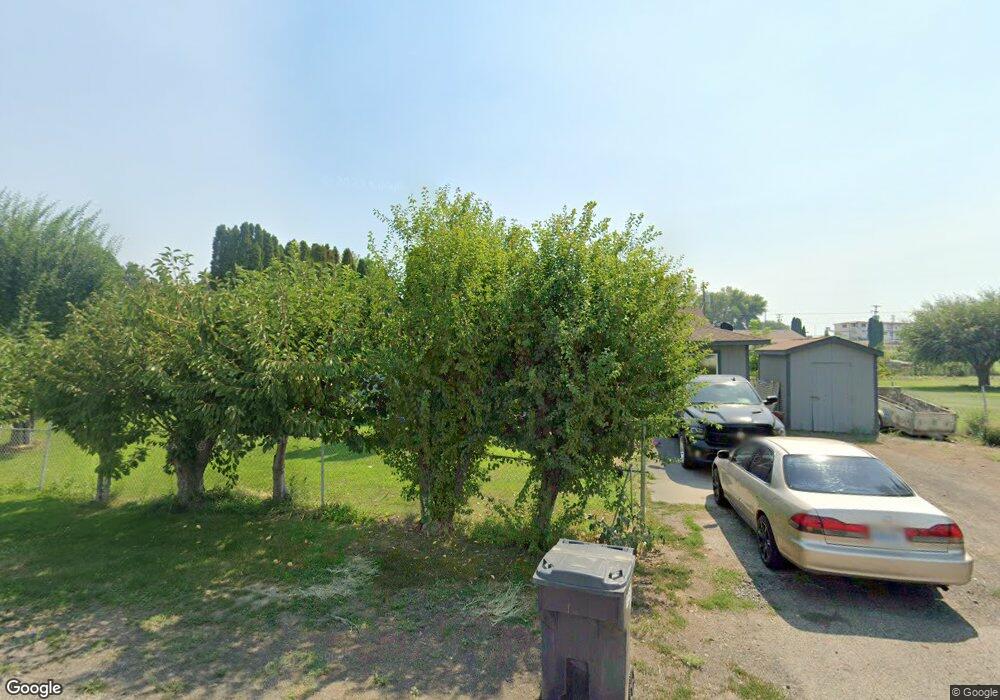
This home is located at 90 Basin Dr, Mesa, WA 99343 and is currently estimated at $301,568, approximately $220 per square foot. 90 Basin Dr is a home located in Franklin County with nearby schools including Connell High School.
Ownership History
Date
Name
Owned For
Owner Type
Purchase Details
Closed on
Oct 30, 2021
Sold by
Salas Maria J
Bought by
Reyra Yakelina A
Current Estimated Value
Purchase Details
Closed on
Nov 27, 2007
Sold by
Salas Silverio and Salas Maria Jovita
Bought by
Salas Silverio C and Salas Maria J
Home Financials for this Owner
Home Financials are based on the most recent Mortgage that was taken out on this home.
Original Mortgage
$36,700
Interest Rate
6.3%
Mortgage Type
New Conventional
Purchase Details
Closed on
Feb 2, 2006
Sold by
Haws Scot R and Haws Lana K
Bought by
Salas Silverio and Salas Maria Jovita
Create a Home Valuation Report for This Property
The Home Valuation Report is an in-depth analysis detailing your home's value as well as a comparison with similar homes in the area
Home Values in the Area
Average Home Value in this Area
Purchase History
| Date | Buyer | Sale Price | Title Company |
|---|---|---|---|
| Reyra Yakelina A | -- | -- | |
| Salas Silverio C | -- | Frontier Title & Escrow Co | |
| Salas Silverio | $70,000 | Benton Franklin Title |
Source: Public Records
Mortgage History
| Date | Status | Borrower | Loan Amount |
|---|---|---|---|
| Previous Owner | Salas Silverio C | $36,700 |
Source: Public Records
Tax History
| Year | Tax Paid | Tax Assessment Tax Assessment Total Assessment is a certain percentage of the fair market value that is determined by local assessors to be the total taxable value of land and additions on the property. | Land | Improvement |
|---|---|---|---|---|
| 2025 | $2,078 | $280,900 | $36,400 | $244,500 |
| 2023 | $1,960 | $280,900 | $36,400 | $244,500 |
| 2022 | $1,334 | $153,500 | $21,800 | $131,700 |
| 2021 | $1,354 | $145,500 | $18,200 | $127,300 |
| 2019 | $1,053 | $119,500 | $19,300 | $100,200 |
| 2018 | $1,119 | $109,800 | $18,400 | $91,400 |
| 2017 | $977 | $103,900 | $17,500 | $86,400 |
| 2015 | $1,135 | $108,900 | $17,500 | $91,400 |
| 2013 | -- | $82,500 | $15,000 | $67,500 |
Source: Public Records
Map
Nearby Homes
Your Personal Tour Guide
Ask me questions while you tour the home.