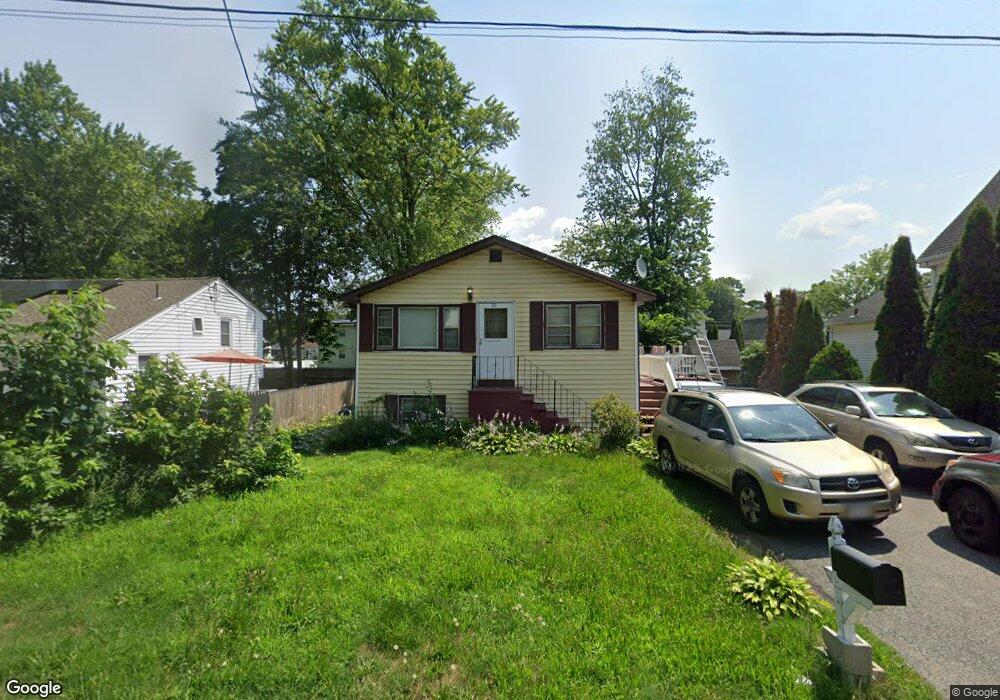
90 Clark St Brockton, MA 02302
Estimated Value: $410,000 - $564,000
3
Beds
1
Bath
1,560
Sq Ft
$308/Sq Ft
Est. Value
About This Home
This home is located at 90 Clark St, Brockton, MA 02302 and is currently estimated at $479,917, approximately $307 per square foot. 90 Clark St is a home located in Plymouth County with nearby schools including Brookfield Elementary School, Downey Elementary School, and Mary E. Baker Elementary School.
Ownership History
Date
Name
Owned For
Owner Type
Purchase Details
Closed on
Sep 4, 2001
Sold by
Rodriguez Audrey M
Bought by
Alteon Marie Ange and Desgraves Jean Claude
Current Estimated Value
Home Financials for this Owner
Home Financials are based on the most recent Mortgage that was taken out on this home.
Original Mortgage
$138,700
Outstanding Balance
$54,361
Interest Rate
7.06%
Mortgage Type
Purchase Money Mortgage
Estimated Equity
$425,556
Create a Home Valuation Report for This Property
The Home Valuation Report is an in-depth analysis detailing your home's value as well as a comparison with similar homes in the area
Purchase History
| Date | Buyer | Sale Price | Title Company |
|---|---|---|---|
| Alteon Marie Ange | $143,000 | -- |
Source: Public Records
Mortgage History
| Date | Status | Borrower | Loan Amount |
|---|---|---|---|
| Open | Alteon Marie Ange | $25,956 | |
| Closed | Alteon Marie Ange | $14,300 | |
| Open | Alteon Marie Ange | $138,700 | |
| Previous Owner | Alteon Marie Ange | $16,200 |
Source: Public Records
Tax History
| Year | Tax Paid | Tax Assessment Tax Assessment Total Assessment is a certain percentage of the fair market value that is determined by local assessors to be the total taxable value of land and additions on the property. | Land | Improvement |
|---|---|---|---|---|
| 2025 | $4,598 | $379,700 | $135,900 | $243,800 |
| 2024 | $4,552 | $378,700 | $135,900 | $242,800 |
| 2023 | $4,503 | $346,900 | $101,800 | $245,100 |
| 2022 | $4,232 | $302,900 | $92,300 | $210,600 |
| 2021 | $4,038 | $278,500 | $76,300 | $202,200 |
| 2020 | $4,037 | $266,500 | $72,000 | $194,500 |
| 2019 | $3,955 | $254,500 | $69,500 | $185,000 |
| 2018 | $3,501 | $218,000 | $69,500 | $148,500 |
| 2017 | $3,212 | $199,500 | $69,500 | $130,000 |
| 2016 | $3,236 | $186,400 | $67,300 | $119,100 |
| 2015 | $2,857 | $157,400 | $67,300 | $90,100 |
| 2014 | $2,899 | $159,900 | $67,300 | $92,600 |
Source: Public Records
Map
Nearby Homes
Your Personal Tour Guide
Ask me questions while you tour the home.