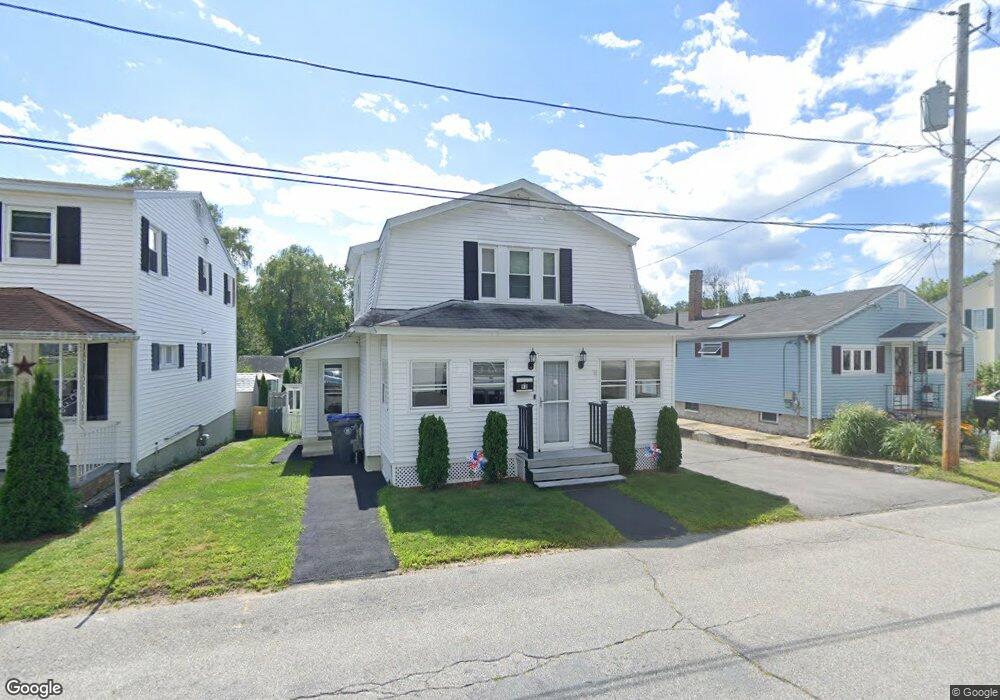
90 Hazel St Methuen, MA 01844
Downtown Methuen NeighborhoodEstimated Value: $508,586 - $574,000
4
Beds
1
Bath
1,486
Sq Ft
$369/Sq Ft
Est. Value
About This Home
This home is located at 90 Hazel St, Methuen, MA 01844 and is currently estimated at $547,897, approximately $368 per square foot. 90 Hazel St is a home located in Essex County with nearby schools including Tenney Grammar School, Methuen High School, and Lawrence Family Development Charter School.
Ownership History
Date
Name
Owned For
Owner Type
Purchase Details
Closed on
Aug 9, 1993
Sold by
Surdo Nicholas D
Bought by
Fleming Daniel L
Current Estimated Value
Purchase Details
Closed on
May 29, 1992
Sold by
Ouellette Richard H
Bought by
Surdo Nicholas D
Create a Home Valuation Report for This Property
The Home Valuation Report is an in-depth analysis detailing your home's value as well as a comparison with similar homes in the area
Home Values in the Area
Average Home Value in this Area
Purchase History
| Date | Buyer | Sale Price | Title Company |
|---|---|---|---|
| Fleming Daniel L | $90,000 | -- | |
| Fleming Daniel L | $90,000 | -- | |
| Surdo Nicholas D | $81,700 | -- | |
| Surdo Nicholas D | $81,700 | -- |
Source: Public Records
Mortgage History
| Date | Status | Borrower | Loan Amount |
|---|---|---|---|
| Open | Surdo Nicholas D | $237,500 | |
| Closed | Surdo Nicholas D | $153,000 |
Source: Public Records
Tax History
| Year | Tax Paid | Tax Assessment Tax Assessment Total Assessment is a certain percentage of the fair market value that is determined by local assessors to be the total taxable value of land and additions on the property. | Land | Improvement |
|---|---|---|---|---|
| 2025 | $4,908 | $463,900 | $213,700 | $250,200 |
| 2024 | $4,681 | $431,000 | $194,900 | $236,100 |
| 2023 | $4,521 | $386,400 | $173,200 | $213,200 |
| 2022 | $4,263 | $326,700 | $144,400 | $182,300 |
| 2021 | $4,018 | $304,600 | $137,100 | $167,500 |
| 2020 | $3,910 | $290,900 | $137,100 | $153,800 |
| 2019 | $3,714 | $261,700 | $122,700 | $139,000 |
| 2018 | $3,639 | $255,000 | $122,700 | $132,300 |
| 2017 | $3,564 | $243,300 | $122,700 | $120,600 |
| 2016 | $3,526 | $238,100 | $115,500 | $122,600 |
| 2015 | $3,405 | $233,200 | $115,500 | $117,700 |
Source: Public Records
Map
Nearby Homes
- 26 Hobson St
- 22 Elm St
- 945 Riverside Dr Unit 5B
- 235 Oakland Ave
- 7 Field Ave
- 20-22 Highgate St
- 12-14 Highgate St
- 16 Highgate St
- 15 Crescent St Unit D
- 11 Crescent St
- 179-181 West St
- 263 Forest St
- 29-31 Washington St
- 16 Marjorie St
- 10 Holly St
- 281 Broadway
- 202 Broadway Unit 2-3
- 202 Broadway Unit 3-2
- 22-24 Cedar St
- 434-438 Hampshire St
Your Personal Tour Guide
Ask me questions while you tour the home.