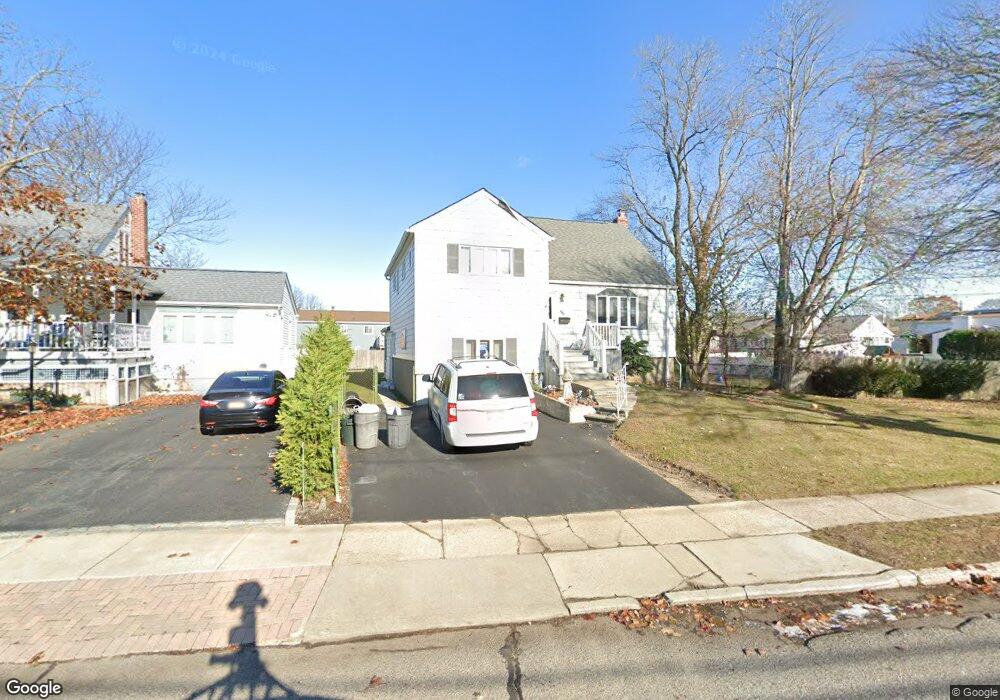
90 Linden St Lindenhurst, NY 11757
Estimated Value: $561,763 - $704,000
Studio
--
Bath
1,864
Sq Ft
$357/Sq Ft
Est. Value
About This Home
This home is located at 90 Linden St, Lindenhurst, NY 11757 and is currently estimated at $664,941, approximately $356 per square foot. 90 Linden St is a home located in Suffolk County with nearby schools including Lindenhurst Middle School and Lindenhurst Senior High School.
Ownership History
Date
Name
Owned For
Owner Type
Purchase Details
Closed on
Jul 28, 2011
Sold by
Bozza Daniel
Bought by
Asaro Jennifer R
Current Estimated Value
Home Financials for this Owner
Home Financials are based on the most recent Mortgage that was taken out on this home.
Original Mortgage
$316,078
Outstanding Balance
$220,675
Interest Rate
4.75%
Mortgage Type
FHA
Estimated Equity
$444,266
Purchase Details
Closed on
Dec 22, 2008
Sold by
Executor Wench John S
Bought by
Bozza Daniel
Home Financials for this Owner
Home Financials are based on the most recent Mortgage that was taken out on this home.
Original Mortgage
$100,000
Interest Rate
6.08%
Create a Home Valuation Report for This Property
The Home Valuation Report is an in-depth analysis detailing your home's value as well as a comparison with similar homes in the area
Home Values in the Area
Average Home Value in this Area
Purchase History
| Date | Buyer | Sale Price | Title Company |
|---|---|---|---|
| Asaro Jennifer R | $324,500 | -- | |
| Bozza Daniel | $335,000 | James Caffrey |
Source: Public Records
Mortgage History
| Date | Status | Borrower | Loan Amount |
|---|---|---|---|
| Open | Asaro Jennifer R | $316,078 | |
| Previous Owner | Bozza Daniel | $100,000 |
Source: Public Records
Tax History
| Year | Tax Paid | Tax Assessment Tax Assessment Total Assessment is a certain percentage of the fair market value that is determined by local assessors to be the total taxable value of land and additions on the property. | Land | Improvement |
|---|---|---|---|---|
| 2024 | $12,292 | $3,320 | $300 | $3,020 |
| 2023 | $11,121 | $3,320 | $300 | $3,020 |
| 2022 | $8,653 | $3,320 | $300 | $3,020 |
| 2021 | $8,653 | $3,320 | $300 | $3,020 |
| 2020 | $10,316 | $3,320 | $300 | $3,020 |
| 2019 | $11,350 | $0 | $0 | $0 |
| 2018 | $8,551 | $3,320 | $300 | $3,020 |
| 2017 | $8,551 | $3,320 | $300 | $3,020 |
| 2016 | $8,595 | $3,320 | $300 | $3,020 |
| 2015 | -- | $3,320 | $300 | $3,020 |
| 2014 | -- | $3,320 | $300 | $3,020 |
Source: Public Records
Map
Nearby Homes
Your Personal Tour Guide
Ask me questions while you tour the home.