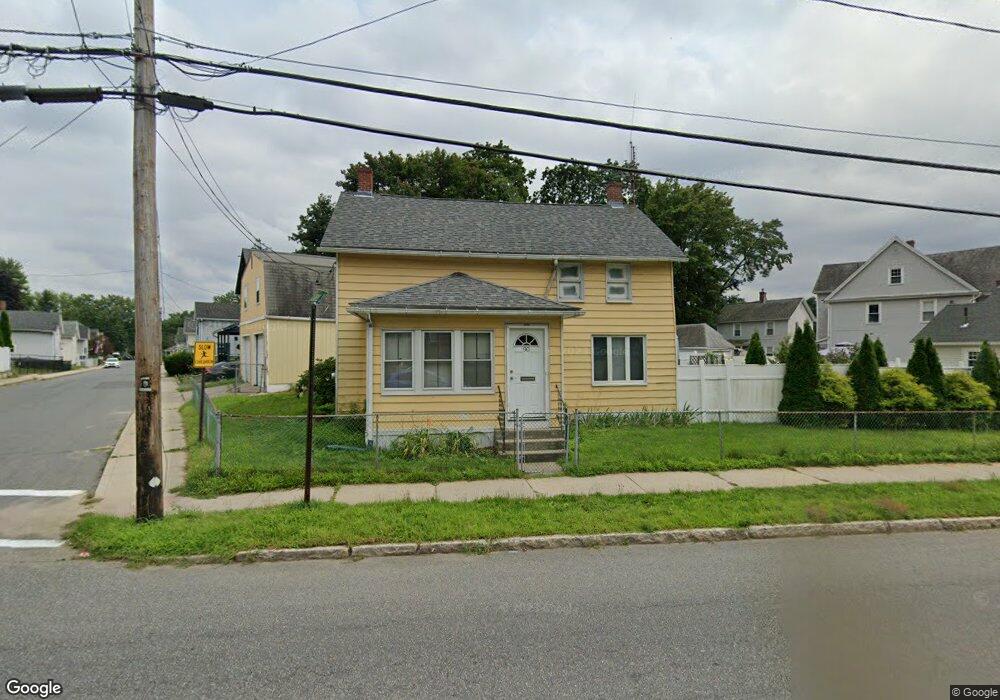
90 Sheridan St Chicopee, MA 01020
Chicopee Falls NeighborhoodEstimated Value: $280,527 - $308,000
3
Beds
1
Bath
1,089
Sq Ft
$267/Sq Ft
Est. Value
About This Home
This home is located at 90 Sheridan St, Chicopee, MA 01020 and is currently estimated at $290,632, approximately $266 per square foot. 90 Sheridan St is a home located in Hampden County with nearby schools including Barry Elementary School, Bellamy Middle School, and Chicopee Comprehensive High School.
Ownership History
Date
Name
Owned For
Owner Type
Purchase Details
Closed on
Oct 28, 1994
Sold by
Kelly John J and Kelly Mary A
Bought by
Taft Russell W and Taft Dorenda L
Current Estimated Value
Home Financials for this Owner
Home Financials are based on the most recent Mortgage that was taken out on this home.
Original Mortgage
$89,760
Interest Rate
8.65%
Mortgage Type
Purchase Money Mortgage
Create a Home Valuation Report for This Property
The Home Valuation Report is an in-depth analysis detailing your home's value as well as a comparison with similar homes in the area
Home Values in the Area
Average Home Value in this Area
Purchase History
We collect this data history from publicly available records. To have your information removed, we recommend requesting removal directly through your county’s website.
| Date | Buyer | Sale Price | Title Company |
|---|---|---|---|
| Taft Russell W | $88,000 | -- |
Source: Public Records
Mortgage History
We collect this data history from publicly available records. To have your information removed, we recommend requesting removal directly through your county’s website.
| Date | Status | Borrower | Loan Amount |
|---|---|---|---|
| Open | Taft Russell W | $50,000 | |
| Closed | Taft Russell W | $89,760 | |
| Previous Owner | Taft Russell W | $90,000 |
Source: Public Records
Tax History
| Year | Tax Paid | Tax Assessment Tax Assessment Total Assessment is a certain percentage of the fair market value that is determined by local assessors to be the total taxable value of land and additions on the property. | Land | Improvement |
|---|---|---|---|---|
| 2025 | $3,710 | $244,700 | $78,200 | $166,500 |
| 2024 | $3,528 | $239,000 | $76,700 | $162,300 |
| 2023 | $3,339 | $220,400 | $69,700 | $150,700 |
| 2022 | $3,248 | $191,200 | $60,600 | $130,600 |
| 2021 | $3,436 | $173,200 | $52,100 | $121,100 |
| 2020 | $2,902 | $166,200 | $52,100 | $114,100 |
| 2019 | $2,872 | $159,900 | $52,100 | $107,800 |
| 2018 | $2,805 | $153,200 | $49,600 | $103,600 |
| 2017 | $2,548 | $147,200 | $44,800 | $102,400 |
| 2016 | $2,501 | $147,900 | $44,800 | $103,100 |
| 2015 | $2,599 | $148,200 | $44,800 | $103,400 |
| 2014 | $2,447 | $148,200 | $44,800 | $103,400 |
Source: Public Records
Map
Nearby Homes
- 264 E Main St
- 239 Fuller Rd
- 283 Fuller Rd Unit T
- 221 East St
- 23 Wildermere St
- 132 Ondrick Dr
- 151 Edgewood Ave
- 118 Edgewood Ave
- 78 Glendale St
- 79 Kaveney St
- 735 Memorial Dr Unit 67
- 1246 Granby Rd Unit 66
- 130 Celebration Cir
- 75 Wheatland Ave
- 101 Frontenac St
- 27 Somerset Rd
- Lot (0) Royalton St
- 111 Woodcrest Cir
- 582 Broadway St
- 43 Grace St
Your Personal Tour Guide
Ask me questions while you tour the home.