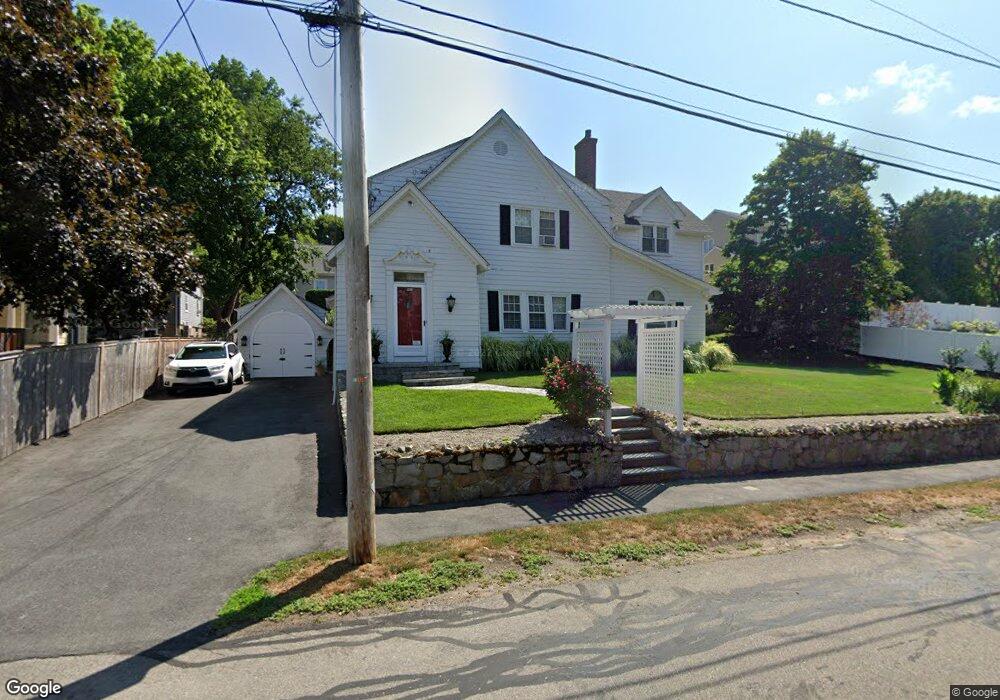
902 E Squantum St Quincy, MA 02171
Squantum NeighborhoodEstimated Value: $1,063,000 - $1,160,574
About This Home
This home is located at 902 E Squantum St, Quincy, MA 02171 and is currently estimated at $1,118,144, approximately $436 per square foot. 902 E Squantum St is a home located in Norfolk County with nearby schools including Squantum Elementary School, Atlantic Middle School, and North Quincy High School.
Ownership History
We collect this data history from publicly available records. To have your information removed, we recommend requesting removal directly through your county’s website.
Purchase Details
Purchase Details
Home Financials for this Owner
Home Financials are based on the most recent Mortgage that was taken out on this home.Home Values in the Area
Average Home Value in this Area
Purchase History
We collect this data history from publicly available records. To have your information removed, we recommend requesting removal directly through your county’s website.
| Date | Buyer | Sale Price | Title Company |
|---|---|---|---|
| -- | -- | ||
| -- | -- | ||
| $225,000 | -- |
Mortgage History
We collect this data history from publicly available records. To have your information removed, we recommend requesting removal directly through your county’s website.
| Date | Status | Borrower | Loan Amount |
|---|---|---|---|
| Previous Owner | $115,000 |
Tax History
We collect this data history from publicly available records. To have your information removed, we recommend requesting removal directly through your county’s website.
| Year | Tax Paid | Tax Assessment Tax Assessment Total Assessment is a certain percentage of the fair market value that is determined by local assessors to be the total taxable value of land and additions on the property. | Land | Improvement |
|---|---|---|---|---|
| 2025 | $11,463 | $994,200 | $452,100 | $542,100 |
| 2024 | $10,770 | $955,600 | $430,800 | $524,800 |
| 2023 | $10,108 | $908,200 | $410,400 | $497,800 |
| 2022 | $10,526 | $878,600 | $342,600 | $536,000 |
| 2021 | $9,927 | $817,700 | $342,600 | $475,100 |
| 2020 | $9,611 | $773,200 | $311,800 | $461,400 |
| 2019 | $9,613 | $766,000 | $311,800 | $454,200 |
| 2018 | $9,459 | $709,100 | $297,100 | $412,000 |
| 2017 | $7,629 | $538,400 | $258,900 | $279,500 |
| 2016 | $7,072 | $492,500 | $235,700 | $256,800 |
| 2015 | $6,871 | $470,600 | $235,700 | $234,900 |
| 2014 | $6,265 | $421,600 | $235,700 | $185,900 |
Map
- 63 Crabtree Rd
- 63 Crabtree Rd (Lot B)
- 63 Crabtree Rd (Lot A)
- 865 E Squantum St
- 18 Livesey Rd
- 156 Crabtree Rd
- 828 E Squantum St
- 24 Bloomfield St
- 1 Parke Ave
- 62 Bay St
- 130 Parke Ave (Lot 2)
- 122 Parke Ave
- 27 Dorchester St
- 69 Standish Rd
- 15 Bellevue Rd
- 145 Dorchester St
- 151 Dorchester St
- 16 Schooner Ln Unit 16
- 7 Cutter Ln
- 100 Marina Dr Unit 411
- 910 E Squantum St
- 84 Knollwood Rd
- 924 E Squantum St
- 80 Knollwood Rd
- 915 E Squantum St
- 921 E Squantum St
- 90 Knollwood Rd
- 88 Knollwood Rd
- 78 Knollwood Rd
- 927 E Squantum St
- 930 E Squantum St
- 934 E Squantum St
- 905 E Squantum St
- 94 Knollwood Rd
- 70 Ashworth Rd
- 64 Ashworth Rd
- 74 Ashworth Rd
- 72 Knollwood Rd
- 58 Ashworth Rd
- 89 Knollwood Rd
Ask me questions while you tour the home.