902 S Union St Kennett Square, PA 19348
Estimated Value: $395,000 - $428,000
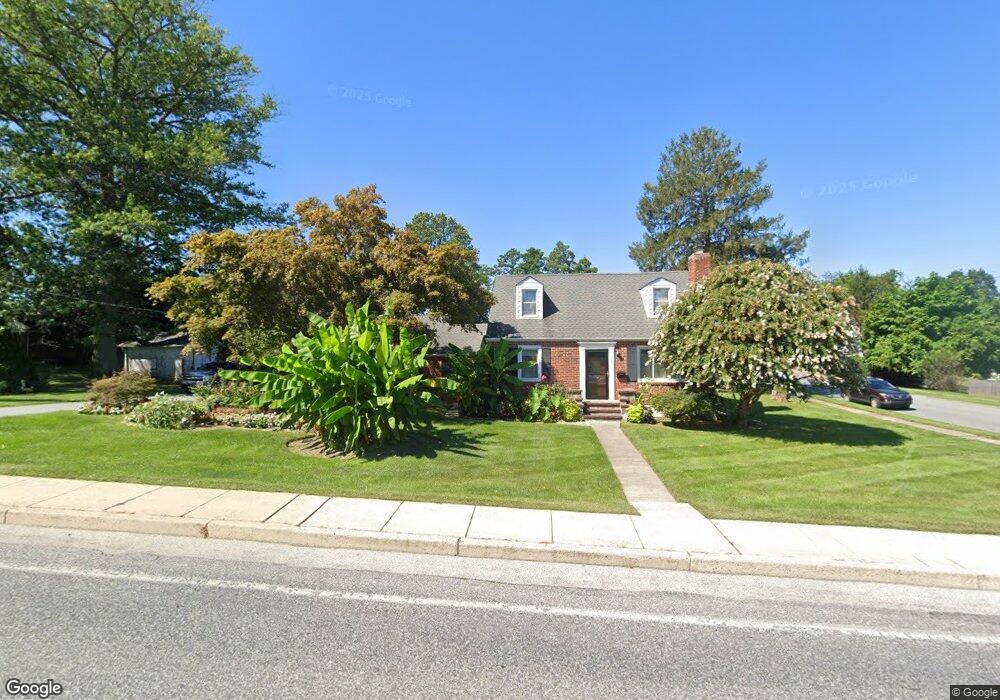
About This Home
This home is located at 902 S Union St, Kennett Square, PA 19348 and is currently estimated at $412,138, approximately $271 per square foot. 902 S Union St is a home located in Chester County with nearby schools including Kennett Middle School, Kennett High School, and St. Patrick School.
Ownership History
We collect this data history from publicly available records. To have your information removed, we recommend requesting removal directly through your county’s website.
Purchase Details
Home Financials for this Owner
Home Financials are based on the most recent Mortgage that was taken out on this home.Purchase Details
Home Financials for this Owner
Home Financials are based on the most recent Mortgage that was taken out on this home.Home Values in the Area
Average Home Value in this Area
Purchase History
We collect this data history from publicly available records. To have your information removed, we recommend requesting removal directly through your county’s website.
| Date | Buyer | Sale Price | Title Company |
|---|---|---|---|
| $127,000 | -- | ||
| $119,000 | -- |
Mortgage History
We collect this data history from publicly available records. To have your information removed, we recommend requesting removal directly through your county’s website.
| Date | Status | Borrower | Loan Amount |
|---|---|---|---|
| Open | $25,400 | ||
| Previous Owner | $35,000 | ||
| Closed | $101,600 |
Tax History
We collect this data history from publicly available records. To have your information removed, we recommend requesting removal directly through your county’s website.
| Year | Tax Paid | Tax Assessment Tax Assessment Total Assessment is a certain percentage of the fair market value that is determined by local assessors to be the total taxable value of land and additions on the property. | Land | Improvement |
|---|---|---|---|---|
| 2026 | $604 | $116,230 | $32,540 | $83,690 |
| 2025 | $5,664 | $116,230 | $32,540 | $83,690 |
| 2024 | $5,664 | $116,230 | $32,540 | $83,690 |
| 2023 | $5,490 | $116,230 | $32,540 | $83,690 |
| 2022 | $5,018 | $116,230 | $32,540 | $83,690 |
| 2021 | $4,973 | $116,230 | $32,540 | $83,690 |
| 2020 | $4,890 | $116,230 | $32,540 | $83,690 |
| 2019 | $4,831 | $116,230 | $32,540 | $83,690 |
| 2018 | $4,719 | $116,230 | $32,540 | $83,690 |
| 2017 | $4,645 | $116,230 | $32,540 | $83,690 |
| 2016 | $461 | $116,230 | $32,540 | $83,690 |
| 2015 | $461 | $116,230 | $32,540 | $83,690 |
| 2014 | $461 | $116,230 | $32,540 | $83,690 |
Map
- 219 E South St
- 614 Oak Ave
- 324 Marshall St Unit 8
- 316 Center St
- 115 Chandler Mill Rd
- 109 Chandler Mill Rd
- 607 W Mulberry St
- 117 Chandler Mill Rd
- 625 W Mulberry St
- 112 Austin Dr
- 118 Austin Dr
- 122 Austin Dr
- 126 Austin Dr
- 601 Magnolia Ct
- 114 Chandler Mill Rd
- 632 Magnolia Ct
- 107 W State St
- 610 D St
- 631 Magnolia Ct
- 105 Kabob Ln
Ask me questions while you tour the home.