Estimated Value: $548,229 - $689,000
Studio
3
Baths
2,293
Sq Ft
$265/Sq Ft
Est. Value
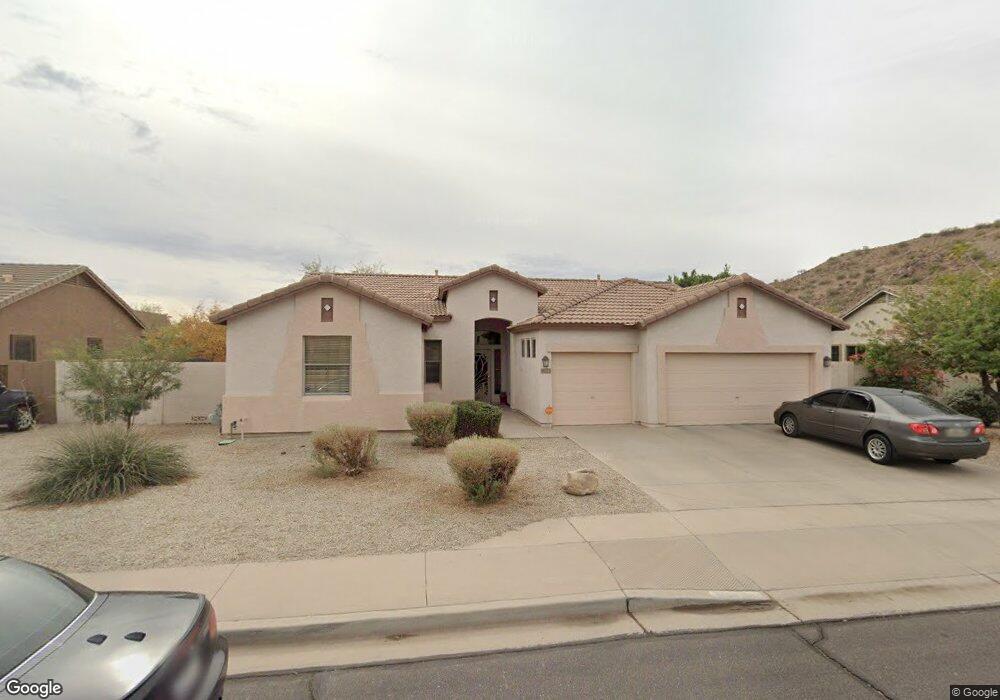
About This Home
This home is located at 9021 E Halifax Cir, Mesa, AZ 85207 and is currently estimated at $606,807, approximately $264 per square foot. 9021 E Halifax Cir is a home located in Maricopa County with nearby schools including Franklin at Brimhall Elementary School, Zaharis Elementary School, and Franklin West Elementary School.
Ownership History
Date
Name
Owned For
Owner Type
Purchase Details
Closed on
Apr 18, 2001
Sold by
Lennar Communities Development Inc
Bought by
Lennar Homes Of Arizona Inc
Current Estimated Value
Home Financials for this Owner
Home Financials are based on the most recent Mortgage that was taken out on this home.
Original Mortgage
$171,399
Outstanding Balance
$58,030
Interest Rate
6.92%
Mortgage Type
New Conventional
Estimated Equity
$548,777
Purchase Details
Closed on
Apr 11, 2001
Sold by
Lennar Homes Of Arizona Inc
Bought by
Agosto Jorge R and Agosto Cheryl A
Home Financials for this Owner
Home Financials are based on the most recent Mortgage that was taken out on this home.
Original Mortgage
$171,399
Outstanding Balance
$58,030
Interest Rate
6.92%
Mortgage Type
New Conventional
Estimated Equity
$548,777
Create a Home Valuation Report for This Property
The Home Valuation Report is an in-depth analysis detailing your home's value as well as a comparison with similar homes in the area
Purchase History
| Date | Buyer | Sale Price | Title Company |
|---|---|---|---|
| Lennar Homes Of Arizona Inc | -- | North American Title Agency | |
| Agosto Jorge R | $185,399 | North American Title Agency |
Source: Public Records
Mortgage History
| Date | Status | Borrower | Loan Amount |
|---|---|---|---|
| Open | Agosto Jorge R | $171,399 |
Source: Public Records
Tax History
| Year | Tax Paid | Tax Assessment Tax Assessment Total Assessment is a certain percentage of the fair market value that is determined by local assessors to be the total taxable value of land and additions on the property. | Land | Improvement |
|---|---|---|---|---|
| 2025 | $2,706 | $32,585 | -- | -- |
| 2024 | $2,736 | $31,034 | -- | -- |
| 2023 | $2,736 | $45,260 | $9,050 | $36,210 |
| 2022 | $2,676 | $35,010 | $7,000 | $28,010 |
| 2021 | $2,749 | $32,020 | $6,400 | $25,620 |
| 2020 | $2,712 | $29,950 | $5,990 | $23,960 |
| 2019 | $2,513 | $28,270 | $5,650 | $22,620 |
| 2018 | $2,399 | $26,320 | $5,260 | $21,060 |
| 2017 | $2,323 | $24,560 | $4,910 | $19,650 |
| 2016 | $2,282 | $24,920 | $4,980 | $19,940 |
| 2015 | $2,154 | $24,830 | $4,960 | $19,870 |
Source: Public Records
Map
Nearby Homes
- 8965 E Hillview St
- 9004 E Grandview Dr
- 9043 E Hobart St
- 9009 E Gary Ln
- 8942 E Hobart St
- 1356 N Bernard
- 9216 E Golden St
- 9251 E Princess Dr
- 1527 N Steele
- 8744 E Fairbrook St
- 8634 E Hillview St
- 1805 N Red Cliff
- 1813 N Red Cliff
- 8750 E Fairfield St
- 8724 E Ivy St
- 1816 N Bernard
- 1832 N Red Cliff
- 8641 E Ivy St
- 9435 E Hobart Cir
- 1000 N 92nd Cir
- 9029 E Halifax Cir
- 9013 E Halifax Cir
- 8931 E Princess Dr
- 9037 E Halifax Cir
- 9018 E Halifax Cir
- 9024 E Halifax Cir
- 8965 E Halifax Cir
- 8555 E Princess Dr
- 9030 E Halifax Cir
- 9012 E Halifax Cir
- 9011 E Princess Dr
- 9017 E Princess Dr
- 9036 E Halifax Cir
- 9006 E Halifax Cir
- 9003 E Princess Dr
- 9025 E Princess Dr
- 9045 E Halifax Cir
- 1426 N 90th Place
- 9031 E Princess Dr
- 8966 E Halifax Cir
Your Personal Tour Guide
Ask me questions while you tour the home.