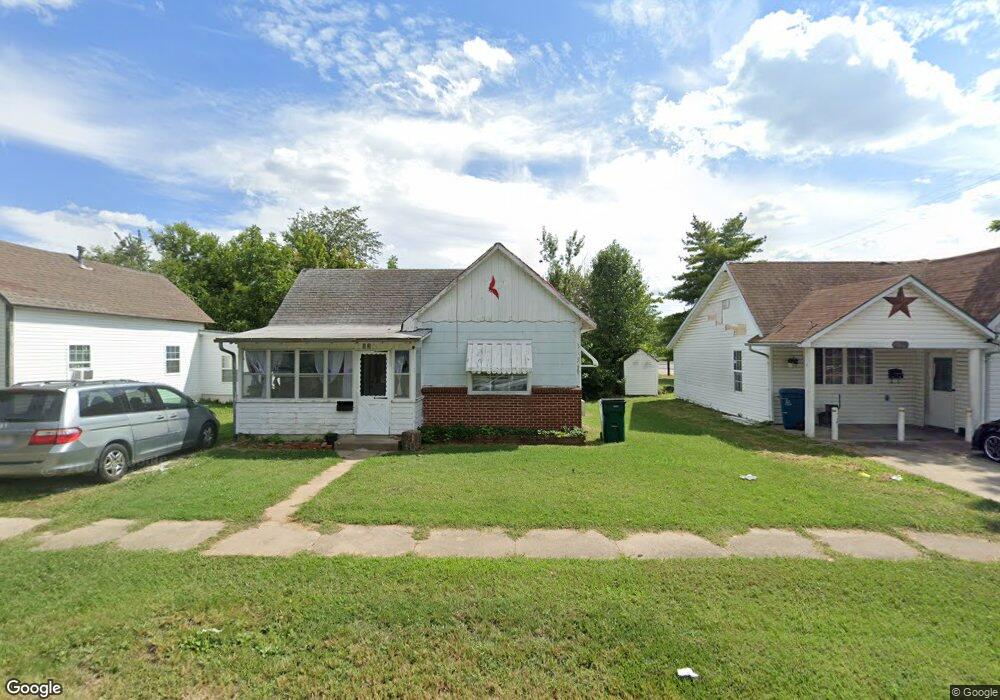
903 E Bond St Monett, MO 65708
Estimated Value: $115,843 - $145,000
3
Beds
1
Bath
1,106
Sq Ft
$122/Sq Ft
Est. Value
About This Home
This home is located at 903 E Bond St, Monett, MO 65708 and is currently estimated at $134,461, approximately $121 per square foot. 903 E Bond St is a home with nearby schools including Monett Elementary School, Monett Intermediate School, and Central Park Elementary School.
Ownership History
Date
Name
Owned For
Owner Type
Purchase Details
Closed on
May 31, 2019
Sold by
Garrett Michael D and Garrett Phyllis D
Bought by
Mendoza Roman Hernandez
Current Estimated Value
Home Financials for this Owner
Home Financials are based on the most recent Mortgage that was taken out on this home.
Original Mortgage
$37,000
Outstanding Balance
$32,532
Interest Rate
4.1%
Mortgage Type
Stand Alone First
Estimated Equity
$101,929
Purchase Details
Closed on
Dec 19, 2013
Sold by
Wormington Marie E
Bought by
Garrett Michael D and Garrett Phyllis D
Purchase Details
Closed on
Nov 18, 2013
Sold by
Wellsandt Ronald E
Bought by
Garrett Michael D and Garrett Phyllis D
Create a Home Valuation Report for This Property
The Home Valuation Report is an in-depth analysis detailing your home's value as well as a comparison with similar homes in the area
Home Values in the Area
Average Home Value in this Area
Purchase History
| Date | Buyer | Sale Price | Title Company |
|---|---|---|---|
| Mendoza Roman Hernandez | -- | Barry County Abstract & Ttl | |
| Garrett Michael D | -- | None Available | |
| Garrett Michael D | -- | None Available |
Source: Public Records
Mortgage History
| Date | Status | Borrower | Loan Amount |
|---|---|---|---|
| Open | Mendoza Roman Hernandez | $37,000 |
Source: Public Records
Tax History
| Year | Tax Paid | Tax Assessment Tax Assessment Total Assessment is a certain percentage of the fair market value that is determined by local assessors to be the total taxable value of land and additions on the property. | Land | Improvement |
|---|---|---|---|---|
| 2025 | $227 | $5,453 | $931 | $4,522 |
| 2024 | $2 | $5,035 | $931 | $4,104 |
| 2023 | $227 | $5,035 | $931 | $4,104 |
| 2022 | $218 | $4,845 | $741 | $4,104 |
| 2020 | $225 | $4,845 | $741 | $4,104 |
| 2018 | $211 | $4,845 | $741 | $4,104 |
| 2017 | $210 | $4,845 | $741 | $4,104 |
| 2016 | $190 | $4,313 | $646 | $3,667 |
| 2015 | -- | $4,313 | $646 | $3,667 |
| 2014 | -- | $4,313 | $646 | $3,667 |
| 2012 | -- | $0 | $0 | $0 |
Source: Public Records
Map
Nearby Homes
Your Personal Tour Guide
Ask me questions while you tour the home.