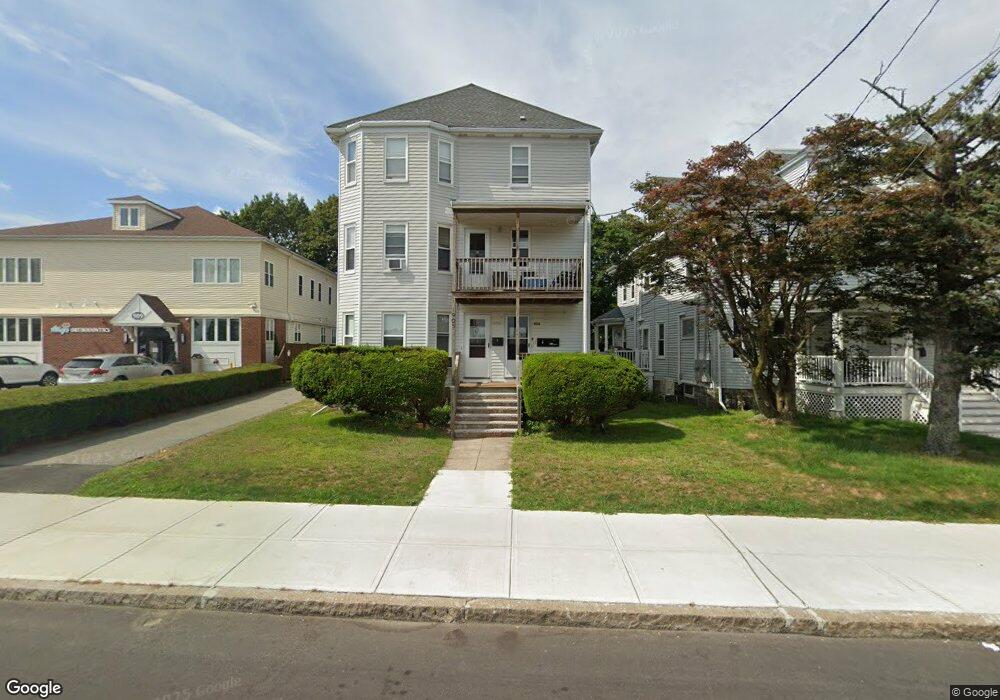
903 Hancock St Quincy, MA 02170
Quincy Center NeighborhoodEstimated Value: $1,096,095 - $1,358,000
6
Beds
3
Baths
3,720
Sq Ft
$317/Sq Ft
Est. Value
About This Home
This home is located at 903 Hancock St, Quincy, MA 02170 and is currently estimated at $1,179,274, approximately $317 per square foot. 903 Hancock St is a home located in Norfolk County with nearby schools including Merrymount Elementary School, Central Middle School, and North Quincy High School.
Ownership History
Date
Name
Owned For
Owner Type
Purchase Details
Closed on
Nov 10, 2021
Sold by
Chen Yan Y and Chen Yane
Bought by
Chen Yan Y and Chen Huan Q
Current Estimated Value
Home Financials for this Owner
Home Financials are based on the most recent Mortgage that was taken out on this home.
Original Mortgage
$221,500
Outstanding Balance
$200,452
Interest Rate
3.01%
Mortgage Type
New Conventional
Estimated Equity
$978,822
Purchase Details
Closed on
Dec 31, 2010
Sold by
Omahony Brian and Omahony Roslynn
Bought by
Chen Yan Yi and Chen Yane
Home Financials for this Owner
Home Financials are based on the most recent Mortgage that was taken out on this home.
Original Mortgage
$305,000
Interest Rate
4.37%
Mortgage Type
Purchase Money Mortgage
Purchase Details
Closed on
Jun 24, 1999
Sold by
Bean Garry
Bought by
Omahony Brian and Omahony Roslynn
Home Financials for this Owner
Home Financials are based on the most recent Mortgage that was taken out on this home.
Original Mortgage
$277,711
Interest Rate
7.09%
Mortgage Type
Purchase Money Mortgage
Purchase Details
Closed on
Jan 23, 1995
Sold by
Johnston Mary L
Bought by
Bean Garry N
Home Financials for this Owner
Home Financials are based on the most recent Mortgage that was taken out on this home.
Original Mortgage
$140,000
Interest Rate
9.16%
Mortgage Type
Purchase Money Mortgage
Create a Home Valuation Report for This Property
The Home Valuation Report is an in-depth analysis detailing your home's value as well as a comparison with similar homes in the area
Home Values in the Area
Average Home Value in this Area
Purchase History
| Date | Buyer | Sale Price | Title Company |
|---|---|---|---|
| Chen Yan Y | -- | None Available | |
| Chen Yan | -- | None Available | |
| Chen Yan Yi | $485,000 | -- | |
| Chen Yan | $485,000 | -- | |
| Omahony Brian | $280,000 | -- | |
| Bean Garry N | $190,000 | -- | |
| Bean Garry | $190,000 | -- | |
| Bean Garry N | $190,000 | -- |
Source: Public Records
Mortgage History
| Date | Status | Borrower | Loan Amount |
|---|---|---|---|
| Open | Chen Yan | $221,500 | |
| Closed | Chen Yan Y | $221,500 | |
| Previous Owner | Chen Yan | $305,000 | |
| Previous Owner | Bean Garry N | $277,711 | |
| Previous Owner | Bean Garry N | $136,000 | |
| Previous Owner | Bean Garry N | $140,000 |
Source: Public Records
Tax History
| Year | Tax Paid | Tax Assessment Tax Assessment Total Assessment is a certain percentage of the fair market value that is determined by local assessors to be the total taxable value of land and additions on the property. | Land | Improvement |
|---|---|---|---|---|
| 2025 | $13,343 | $1,157,200 | $330,400 | $826,800 |
| 2024 | $12,433 | $1,103,200 | $312,100 | $791,100 |
| 2023 | $11,487 | $1,032,100 | $297,200 | $734,900 |
| 2022 | $11,050 | $922,400 | $237,800 | $684,600 |
| 2021 | $10,222 | $842,000 | $237,800 | $604,200 |
| 2020 | $10,153 | $816,800 | $223,700 | $593,100 |
| 2019 | $9,227 | $735,200 | $209,100 | $526,100 |
| 2018 | $9,275 | $695,300 | $202,000 | $493,300 |
| 2017 | $9,592 | $676,900 | $202,000 | $474,900 |
| 2016 | $8,605 | $599,200 | $192,300 | $406,900 |
| 2015 | $8,093 | $554,300 | $180,700 | $373,600 |
| 2014 | $7,157 | $481,600 | $168,300 | $313,300 |
Source: Public Records
Map
Nearby Homes
- 915 Hancock St Unit 2
- 45 Oval Rd Unit 34
- 999 Hancock St Unit 402
- 72 Oakland Ave
- 163 Clay St Unit 3
- 44 Armory St
- 1025 Hancock St Unit 11M
- 100 Grand View Ave Unit 9C
- 148 Furnace Brook Pkwy
- 19 Bass St
- 10 Edgemere Rd
- 20 Whitney Rd Unit 7
- 20 Whitney Rd Unit 1
- 113 Elm Ave
- 267-269 Farrington St
- 165 Whitwell St
- 195 Thomas Burgin Pkwy Unit 212
- 195 Thomas Burgin Pkwy Unit 301
- 105 Sea St Unit 105
- 105 Sea St Unit 102
- 903 Hancock St Unit 2
- 909 Hancock St Unit 1
- 909 Hancock St
- 909 Hancock St Unit 2
- 909 Hancock St Unit 2 A
- 899-901 Hancock St Unit 899
- 901 Hancock St Unit Left
- 11 Oval Rd
- 893 Hancock St
- 893 Hancock St Unit 2
- 6 Oval Rd Unit 5
- 6 Oval Rd Unit 4
- 6 Oval Rd Unit 3
- 6 Oval Rd Unit 2
- 6 Oval Rd Unit 1
- 17 Oval Rd
- 22 Saint Anns Rd Unit B
- 22 Saint Anns Rd Unit D
- 22 St Anns Rd Unit B
- 22 Saint Anns Rd
Your Personal Tour Guide
Ask me questions while you tour the home.