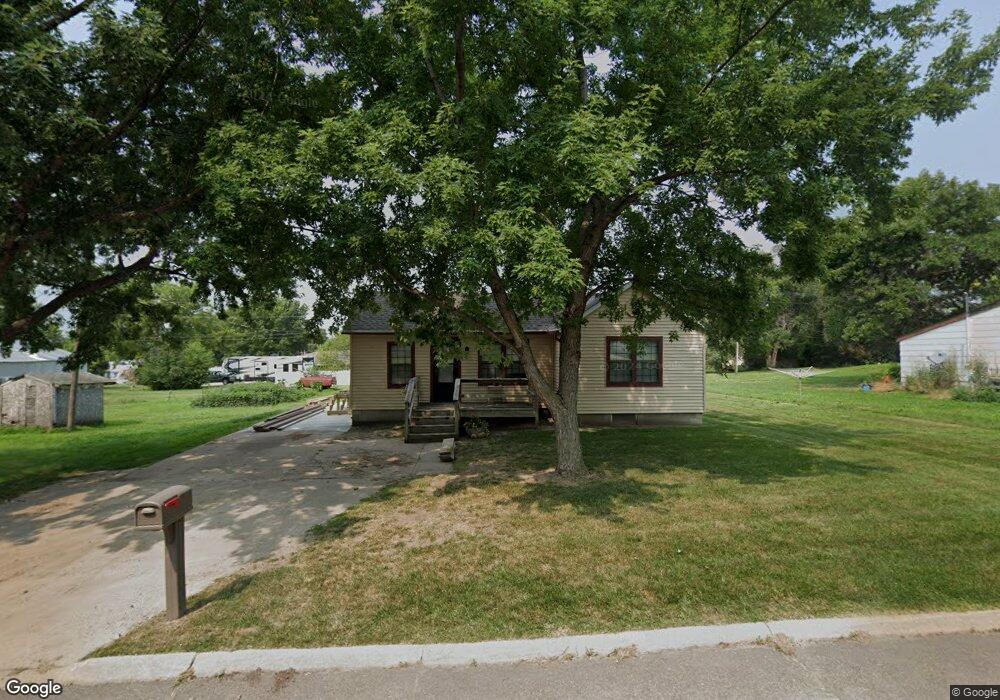
906 P St Neligh, NE 68756
Estimated Value: $90,000 - $130,000
1
Bed
1
Bath
832
Sq Ft
$130/Sq Ft
Est. Value
About This Home
This home is located at 906 P St, Neligh, NE 68756 and is currently estimated at $108,313, approximately $130 per square foot. 906 P St is a home located in Antelope County.
Ownership History
Date
Name
Owned For
Owner Type
Purchase Details
Closed on
Jul 9, 2025
Sold by
Kuester Steven V and Kuester Linda M
Bought by
Boggs Troy A
Current Estimated Value
Home Financials for this Owner
Home Financials are based on the most recent Mortgage that was taken out on this home.
Original Mortgage
$126,060
Outstanding Balance
$125,845
Interest Rate
6.81%
Mortgage Type
New Conventional
Estimated Equity
-$17,532
Purchase Details
Closed on
Sep 10, 2018
Sold by
Trent Hoefer and Trent Hannah
Bought by
Kuester Steven V
Home Financials for this Owner
Home Financials are based on the most recent Mortgage that was taken out on this home.
Original Mortgage
$25,000
Interest Rate
4.5%
Mortgage Type
New Conventional
Create a Home Valuation Report for This Property
The Home Valuation Report is an in-depth analysis detailing your home's value as well as a comparison with similar homes in the area
Purchase History
| Date | Buyer | Sale Price | Title Company |
|---|---|---|---|
| Boggs Troy A | $130,000 | American Title | |
| Boggs Troy A | $130,000 | American Title | |
| Kuester Steven V | $16,100 | Other |
Source: Public Records
Mortgage History
| Date | Status | Borrower | Loan Amount |
|---|---|---|---|
| Open | Boggs Troy A | $126,060 | |
| Closed | Boggs Troy A | $126,060 | |
| Previous Owner | Kuester Steven V | $25,000 |
Source: Public Records
Tax History
| Year | Tax Paid | Tax Assessment Tax Assessment Total Assessment is a certain percentage of the fair market value that is determined by local assessors to be the total taxable value of land and additions on the property. | Land | Improvement |
|---|---|---|---|---|
| 2025 | $1,023 | $82,085 | $5,385 | $76,700 |
| 2024 | $853 | $64,815 | $5,385 | $59,430 |
| 2023 | $1,256 | $64,165 | $4,750 | $59,415 |
| 2022 | $1,188 | $59,040 | $3,170 | $55,870 |
| 2021 | $1,182 | $59,040 | $3,170 | $55,870 |
| 2020 | $847 | $41,000 | $3,170 | $37,830 |
| 2019 | $773 | $38,965 | $815 | $38,150 |
| 2018 | $181 | $9,370 | $815 | $8,555 |
| 2017 | $179 | $9,370 | $815 | $8,555 |
| 2016 | $173 | $9,370 | $815 | $8,555 |
| 2015 | -- | $9,370 | $815 | $8,555 |
| 2014 | $194 | $9,235 | $815 | $8,420 |
Source: Public Records
Map
Nearby Homes
Your Personal Tour Guide
Ask me questions while you tour the home.