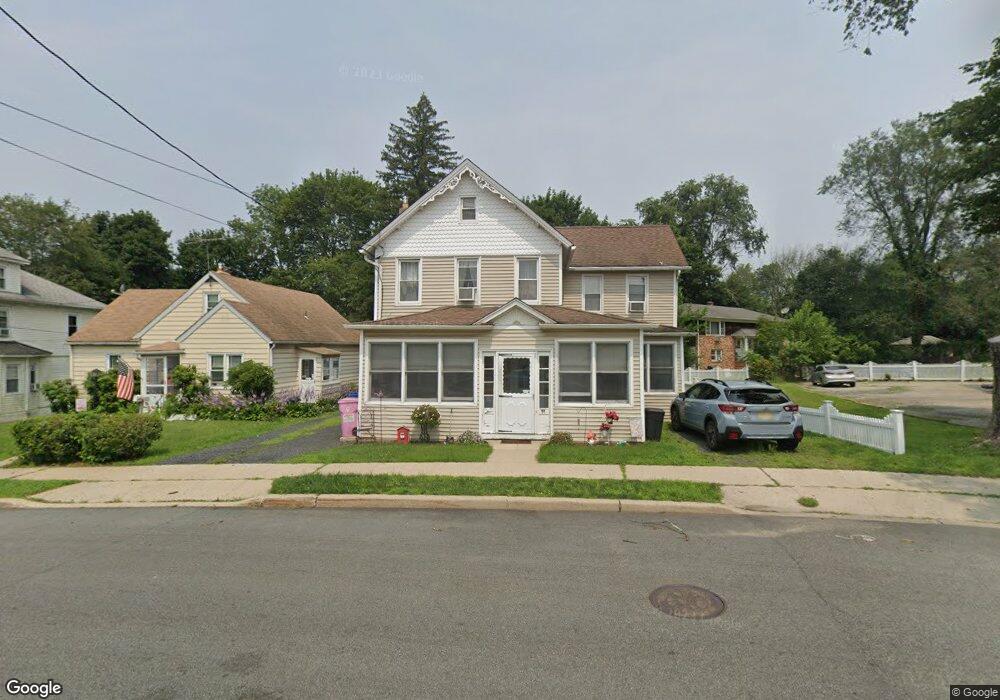
91 Allen St Unit B Netcong, NJ 07857
Estimated Value: $393,000 - $517,000
2
Beds
1
Bath
1,752
Sq Ft
$267/Sq Ft
Est. Value
About This Home
This home is located at 91 Allen St Unit B, Netcong, NJ 07857 and is currently estimated at $468,327, approximately $267 per square foot. 91 Allen St Unit B is a home located in Morris County with nearby schools including Netcong Elementary School and Lenape Val Regional High School.
Ownership History
Date
Name
Owned For
Owner Type
Purchase Details
Closed on
Oct 1, 2024
Sold by
Mcmahon Arthur F and Mcmahon Judith Ann
Bought by
Fernandez Victor
Current Estimated Value
Purchase Details
Closed on
May 21, 1997
Sold by
Shaver Richard A and Shaver Alma J
Bought by
Mcmahon Arthur F and Mcmahon Judith Ann
Home Financials for this Owner
Home Financials are based on the most recent Mortgage that was taken out on this home.
Original Mortgage
$80,000
Interest Rate
8.09%
Create a Home Valuation Report for This Property
The Home Valuation Report is an in-depth analysis detailing your home's value as well as a comparison with similar homes in the area
Home Values in the Area
Average Home Value in this Area
Purchase History
We collect this data history from publicly available records. To have your information removed, we recommend requesting removal directly through your county’s website.
| Date | Buyer | Sale Price | Title Company |
|---|---|---|---|
| Fernandez Victor | $440,000 | Fidelity National Title | |
| Fernandez Victor | $440,000 | Fidelity National Title | |
| Fernandez Victor | $440,000 | Fidelity National Title | |
| Mcmahon Arthur F | $118,000 | Chicago Title Insurance Co |
Source: Public Records
Mortgage History
We collect this data history from publicly available records. To have your information removed, we recommend requesting removal directly through your county’s website.
| Date | Status | Borrower | Loan Amount |
|---|---|---|---|
| Previous Owner | Mcmahon Arthur F | $80,000 |
Source: Public Records
Tax History
| Year | Tax Paid | Tax Assessment Tax Assessment Total Assessment is a certain percentage of the fair market value that is determined by local assessors to be the total taxable value of land and additions on the property. | Land | Improvement |
|---|---|---|---|---|
| 2025 | $9,291 | $271,900 | $102,100 | $169,800 |
| 2024 | $9,372 | $271,900 | $102,100 | $169,800 |
| 2023 | $9,372 | $271,900 | $102,100 | $169,800 |
| 2022 | $8,491 | $271,900 | $102,100 | $169,800 |
| 2021 | $8,491 | $271,900 | $102,100 | $169,800 |
| 2020 | $7,752 | $252,000 | $154,300 | $97,700 |
| 2019 | $7,379 | $252,000 | $154,300 | $97,700 |
| 2018 | $7,708 | $280,000 | $154,300 | $125,700 |
| 2017 | $7,406 | $280,000 | $154,300 | $125,700 |
| 2016 | $7,204 | $280,000 | $154,300 | $125,700 |
| 2015 | $6,941 | $280,000 | $154,300 | $125,700 |
| 2014 | $6,639 | $280,000 | $154,300 | $125,700 |
Source: Public Records
Map
Nearby Homes
Your Personal Tour Guide
Ask me questions while you tour the home.