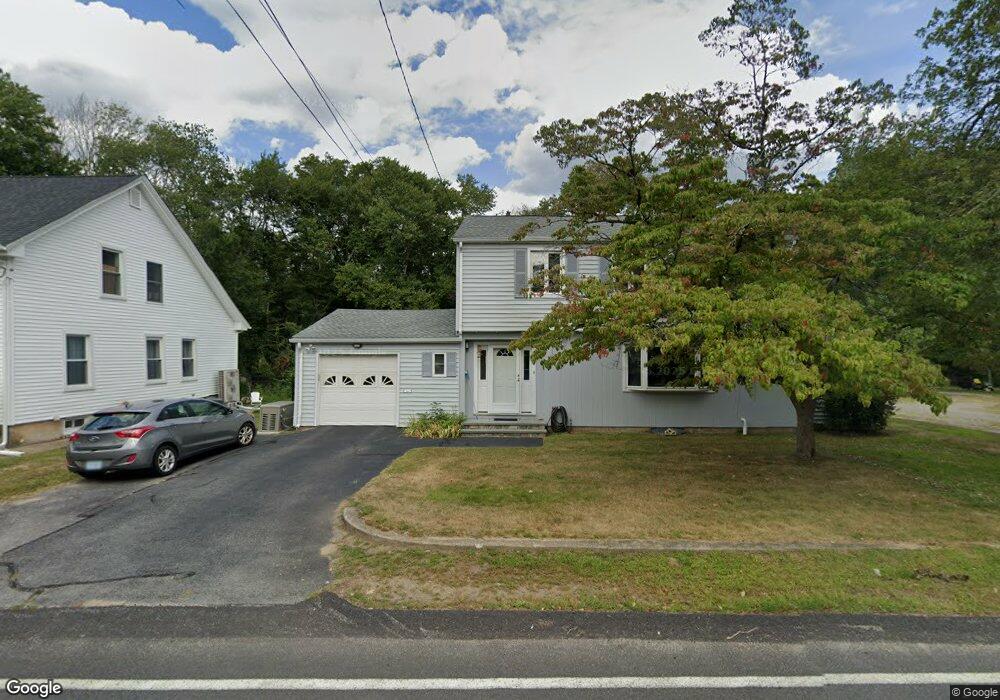
91 Boston St Coventry, RI 02816
Estimated Value: $392,522 - $442,000
3
Beds
2
Baths
1,560
Sq Ft
$264/Sq Ft
Est. Value
About This Home
This home is located at 91 Boston St, Coventry, RI 02816 and is currently estimated at $412,131, approximately $264 per square foot. 91 Boston St is a home located in Kent County with nearby schools including Alan Shawn Feinstein Ms Of Cov, Coventry High School, and Father John V. Doyle School.
Ownership History
Date
Name
Owned For
Owner Type
Purchase Details
Closed on
Jan 18, 2023
Sold by
Arel Deborah J
Bought by
Deborah Arel Lt
Current Estimated Value
Purchase Details
Closed on
Oct 3, 1988
Sold by
Fricot Ghislain A
Bought by
Arel Claude M
Create a Home Valuation Report for This Property
The Home Valuation Report is an in-depth analysis detailing your home's value as well as a comparison with similar homes in the area
Purchase History
We collect this data history from publicly available records. To have your information removed, we recommend requesting removal directly through your county’s website.
| Date | Buyer | Sale Price | Title Company |
|---|---|---|---|
| Deborah Arel Lt | -- | None Available | |
| Arel Claude M | $135,000 | -- |
Source: Public Records
Mortgage History
We collect this data history from publicly available records. To have your information removed, we recommend requesting removal directly through your county’s website.
| Date | Status | Borrower | Loan Amount |
|---|---|---|---|
| Previous Owner | Arel Claude M | $40,000 | |
| Previous Owner | Arel Claude M | $125,000 | |
| Previous Owner | Arel Claude M | $128,800 | |
| Previous Owner | Arel Claude M | $15,000 |
Source: Public Records
Tax History
| Year | Tax Paid | Tax Assessment Tax Assessment Total Assessment is a certain percentage of the fair market value that is determined by local assessors to be the total taxable value of land and additions on the property. | Land | Improvement |
|---|---|---|---|---|
| 2025 | $4,824 | $299,800 | $98,200 | $201,600 |
| 2024 | $4,749 | $299,800 | $98,200 | $201,600 |
| 2023 | $4,596 | $299,800 | $98,200 | $201,600 |
| 2022 | $4,517 | $230,800 | $93,900 | $136,900 |
| 2021 | $4,478 | $230,800 | $93,900 | $136,900 |
| 2020 | $5,133 | $230,800 | $93,900 | $136,900 |
| 2019 | $4,432 | $199,300 | $79,000 | $120,300 |
| 2018 | $4,307 | $199,300 | $79,000 | $120,300 |
| 2017 | $4,181 | $199,300 | $79,000 | $120,300 |
| 2016 | $4,209 | $196,600 | $74,600 | $122,000 |
| 2015 | $4,095 | $196,600 | $74,600 | $122,000 |
| 2014 | $3,847 | $196,600 | $74,600 | $122,000 |
| 2013 | $3,691 | $197,800 | $88,000 | $109,800 |
Source: Public Records
Map
Nearby Homes
- 31 Anthony St Unit 33
- 29 Anthony St
- 144 Blackrock Rd
- 432 Fairview Ave
- 12 Hazard St
- 6 Pilgrim Ave
- 376 Fairview Ave
- 9 Regent St Unit 11
- 9 Long Pond Rd
- 32 Pilgrim Ave
- 513 Washington St
- 505 Washington St
- 75 Knotty Oak Rd
- 78 Gervais St
- 15 Laforge Dr
- 15 Hope Ct
- 325 Washington St Unit 1
- 70 East St
- 117 Station St
- 37 Holden St
Your Personal Tour Guide
Ask me questions while you tour the home.