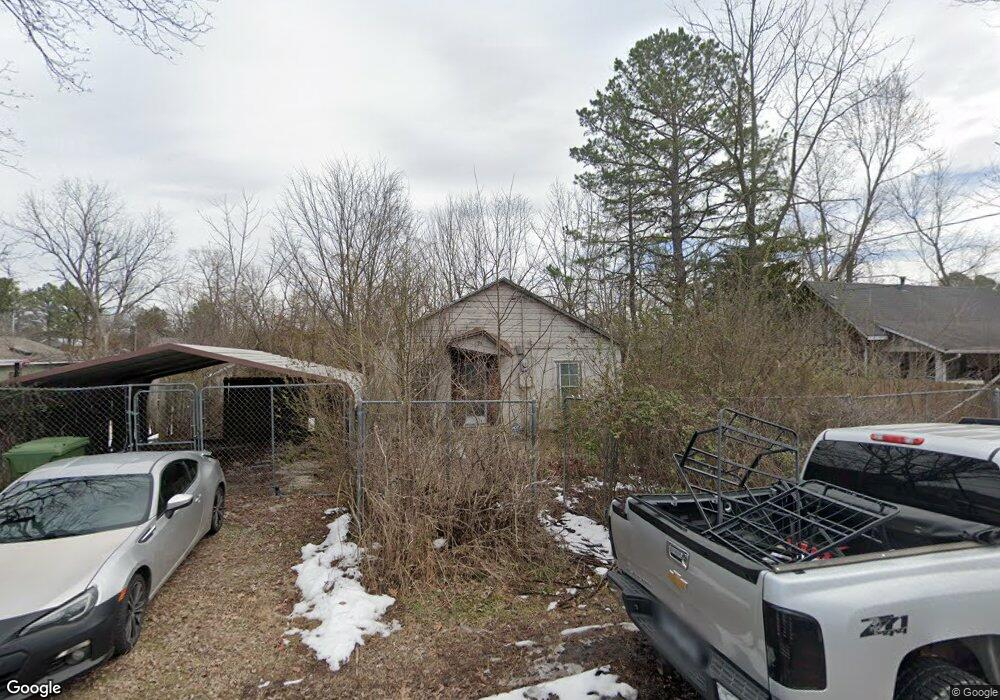
911 S D St Rogers, AR 72756
Estimated Value: $165,930 - $258,000
2
Beds
1
Bath
650
Sq Ft
$305/Sq Ft
Est. Value
About This Home
This home is located at 911 S D St, Rogers, AR 72756 and is currently estimated at $198,233, approximately $304 per square foot. 911 S D St is a home located in Benton County with nearby schools including Eastside Elementary School, Lingle Middle School, and Rogers Heritage High School.
Ownership History
Date
Name
Owned For
Owner Type
Purchase Details
Closed on
Dec 6, 1999
Bought by
Ebbs
Current Estimated Value
Purchase Details
Closed on
May 23, 1997
Bought by
Severs
Purchase Details
Closed on
Dec 15, 1992
Bought by
Vu
Purchase Details
Closed on
Aug 14, 1992
Bought by
Hud
Purchase Details
Closed on
Jun 25, 1992
Bought by
Principal Mutual Life
Purchase Details
Closed on
Nov 26, 1990
Bought by
Tucker
Purchase Details
Closed on
Jul 11, 1990
Bought by
Boggs
Purchase Details
Closed on
May 22, 1990
Bought by
Boggs
Create a Home Valuation Report for This Property
The Home Valuation Report is an in-depth analysis detailing your home's value as well as a comparison with similar homes in the area
Home Values in the Area
Average Home Value in this Area
Purchase History
We collect this data history from publicly available records. To have your information removed, we recommend requesting removal directly through your county’s website.
| Date | Buyer | Sale Price | Title Company |
|---|---|---|---|
| Ebbs | $39,000 | -- | |
| Severs | $23,000 | -- | |
| Vu | -- | -- | |
| Hud | -- | -- | |
| Principal Mutual Life | -- | -- | |
| Tucker | -- | -- | |
| Boggs | -- | -- | |
| Boggs | -- | -- |
Source: Public Records
Tax History
| Year | Tax Paid | Tax Assessment Tax Assessment Total Assessment is a certain percentage of the fair market value that is determined by local assessors to be the total taxable value of land and additions on the property. | Land | Improvement |
|---|---|---|---|---|
| 2025 | $688 | $27,750 | $19,000 | $8,750 |
| 2024 | $615 | $27,750 | $19,000 | $8,750 |
| 2023 | $559 | $15,110 | $8,000 | $7,110 |
| 2022 | $537 | $15,110 | $8,000 | $7,110 |
| 2021 | $491 | $15,110 | $8,000 | $7,110 |
| 2020 | $447 | $8,140 | $2,400 | $5,740 |
| 2019 | $447 | $8,140 | $2,400 | $5,740 |
| 2018 | $447 | $8,140 | $2,400 | $5,740 |
| 2017 | $422 | $8,140 | $2,400 | $5,740 |
| 2016 | $422 | $8,140 | $2,400 | $5,740 |
| 2015 | $475 | $8,970 | $2,600 | $6,370 |
| 2014 | $125 | $8,970 | $2,600 | $6,370 |
Source: Public Records
Map
Nearby Homes
- 429 E Mulberry St
- 1013 S 1st St
- 121 E Veterans Pkwy
- 217 W Birch St
- 1203 S 3rd St
- Lot N/2 Blk 6-10/1 Roberts & Musteen Add
- Lot 7 S 3rd St
- Lot 5 S 3rd St
- Lot 6 S 3rd St
- 1434 S Monte Northeast Rd
- 1.47 Acres E Allen St
- 702 E Sumac St
- 1016 S 4th St
- 1530 Monte Ne Rd
- 0 E Spring St
- 1219 S 5th St
- 1706 S F St
- 710 S 6th St
- 525 S 6th St
- 1810 S H St
Your Personal Tour Guide
Ask me questions while you tour the home.