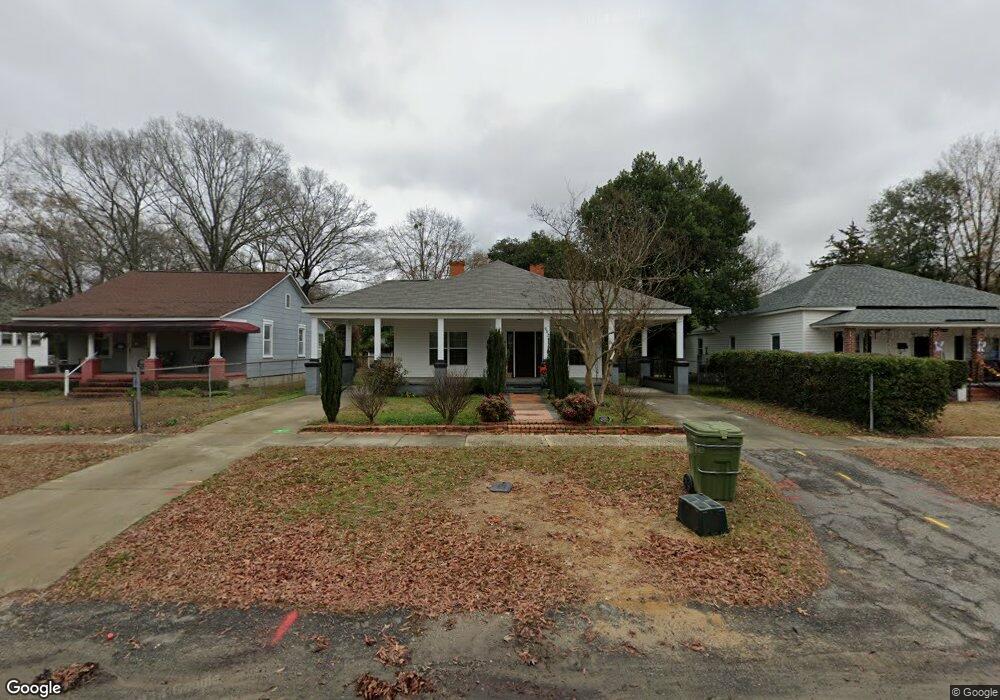
912 Fair St Camden, SC 29020
Estimated Value: $196,000 - $237,038
2
Beds
2
Baths
1,395
Sq Ft
$158/Sq Ft
Est. Value
About This Home
This home is located at 912 Fair St, Camden, SC 29020 and is currently estimated at $220,010, approximately $157 per square foot. 912 Fair St is a home located in Kershaw County with nearby schools including Jackson Elementary School, Pine Tree Hill Elementary School, and Camden Middle School.
Ownership History
Date
Name
Owned For
Owner Type
Purchase Details
Closed on
Dec 12, 2023
Sold by
Anthony Crystal D
Bought by
Schumacher Lindsey
Current Estimated Value
Home Financials for this Owner
Home Financials are based on the most recent Mortgage that was taken out on this home.
Original Mortgage
$195,395
Outstanding Balance
$192,310
Interest Rate
7.76%
Mortgage Type
FHA
Estimated Equity
$27,700
Purchase Details
Closed on
Jan 22, 2002
Sold by
Breidor Mark
Bought by
Breidor Timothy S and Breidor John L
Create a Home Valuation Report for This Property
The Home Valuation Report is an in-depth analysis detailing your home's value as well as a comparison with similar homes in the area
Purchase History
We collect this data history from publicly available records. To have your information removed, we recommend requesting removal directly through your county’s website.
| Date | Buyer | Sale Price | Title Company |
|---|---|---|---|
| Schumacher Lindsey | $199,000 | None Listed On Document | |
| Breidor Timothy S | -- | -- |
Source: Public Records
Mortgage History
We collect this data history from publicly available records. To have your information removed, we recommend requesting removal directly through your county’s website.
| Date | Status | Borrower | Loan Amount |
|---|---|---|---|
| Open | Schumacher Lindsey | $195,395 |
Source: Public Records
Tax History
| Year | Tax Paid | Tax Assessment Tax Assessment Total Assessment is a certain percentage of the fair market value that is determined by local assessors to be the total taxable value of land and additions on the property. | Land | Improvement |
|---|---|---|---|---|
| 2025 | $4,552 | $199,000 | $40,000 | $159,000 |
| 2024 | $4,552 | $199,000 | $40,000 | $159,000 |
| 2023 | $654 | $139,600 | $30,000 | $109,600 |
| 2022 | $903 | $139,600 | $30,000 | $109,600 |
| 2021 | $823 | $139,600 | $30,000 | $109,600 |
| 2020 | $851 | $130,000 | $30,000 | $100,000 |
| 2019 | $878 | $130,000 | $30,000 | $100,000 |
| 2018 | $887 | $130,000 | $30,000 | $100,000 |
| 2017 | $833 | $130,000 | $30,000 | $100,000 |
| 2016 | $1,529 | $71,000 | $15,600 | $55,400 |
| 2015 | $1,177 | $71,000 | $15,600 | $55,400 |
| 2014 | $1,177 | $0 | $0 | $0 |
Source: Public Records
Map
Nearby Homes
- 306 Hampton Park
- 1109 Lyttleton St
- 1301 Fair St
- 1313 Fair St
- 1305 Fair St
- 1205 Mill St
- 1218 Mill St
- 1302 Mill St
- 817 Church St
- 1403 Lyttleton St
- 1408 Mill St
- 1412 Fair St
- 31 Gardner St
- 1310 Lyttleton St
- 1302 Lyttleton St
- 1201 Campbell St
- 98 Ridge Circle Dr
- 93 Ridge Circle Dr
- 110 Ridge Circle Dr
- 1110 Roberts St
Your Personal Tour Guide
Ask me questions while you tour the home.