912 Maple St Fall River, MA 02720
Bank Street NeighborhoodEstimated Value: $395,295 - $451,000
About This Home
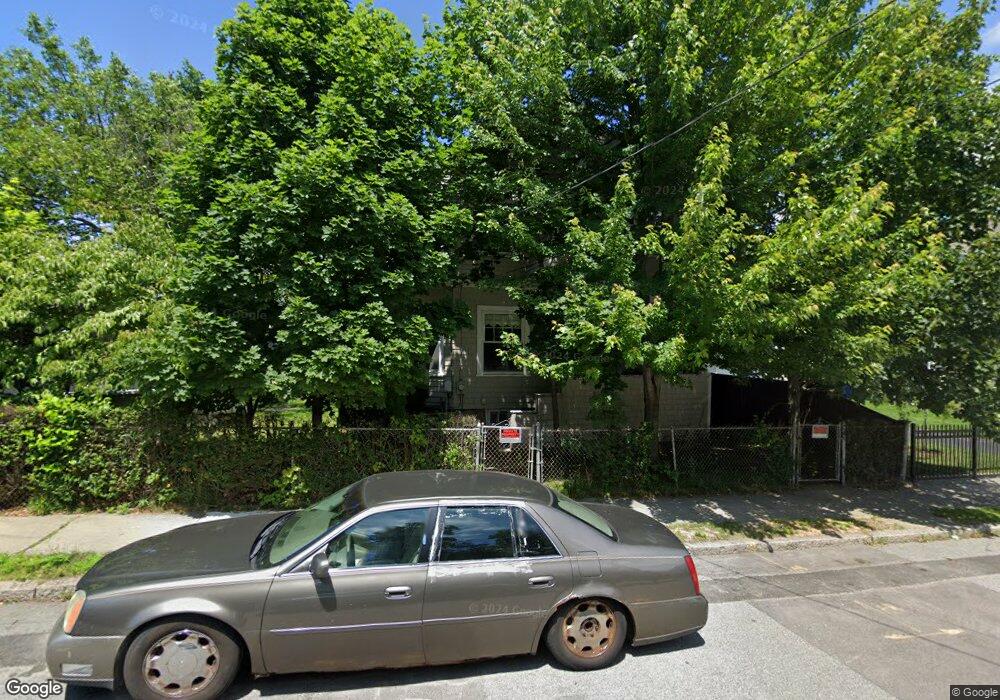
This home is located at 912 Maple St, Fall River, MA 02720 and is currently estimated at $433,324, approximately $250 per square foot. 912 Maple St is a home located in Bristol County with nearby schools including Spencer Borden Elementary School, Morton Middle School, and B M C Durfee High School.
Ownership History
We collect this data history from publicly available records. To have your information removed, we recommend requesting removal directly through your county’s website.
Purchase Details
Purchase Details
Home Values in the Area
Average Home Value in this Area
Purchase History
We collect this data history from publicly available records. To have your information removed, we recommend requesting removal directly through your county’s website.
| Date | Buyer | Sale Price | Title Company |
|---|---|---|---|
| $108,000 | -- | ||
| $130,000 | -- |
Mortgage History
We collect this data history from publicly available records. To have your information removed, we recommend requesting removal directly through your county’s website.
| Date | Status | Borrower | Loan Amount |
|---|---|---|---|
| Open | $148,000 | ||
| Closed | $115,000 |
Tax History
We collect this data history from publicly available records. To have your information removed, we recommend requesting removal directly through your county’s website.
| Year | Tax Paid | Tax Assessment Tax Assessment Total Assessment is a certain percentage of the fair market value that is determined by local assessors to be the total taxable value of land and additions on the property. | Land | Improvement |
|---|---|---|---|---|
| 2025 | $3,606 | $314,900 | $116,400 | $198,500 |
| 2024 | $3,414 | $297,100 | $114,200 | $182,900 |
| 2023 | $3,416 | $278,400 | $102,900 | $175,500 |
| 2022 | $3,075 | $243,700 | $97,000 | $146,700 |
| 2021 | $2,947 | $213,100 | $92,700 | $120,400 |
| 2020 | $2,906 | $201,100 | $88,500 | $112,600 |
| 2019 | $2,923 | $200,500 | $92,500 | $108,000 |
| 2018 | $2,885 | $197,300 | $93,200 | $104,100 |
| 2017 | $2,737 | $195,500 | $93,200 | $102,300 |
| 2016 | $2,622 | $192,400 | $96,000 | $96,400 |
| 2015 | $2,519 | $192,600 | $96,000 | $96,600 |
| 2014 | $2,423 | $192,600 | $96,000 | $96,600 |
Map
- 37 Shawmut St
- 615 Robeson St
- 51 Summerfield St
- 47 Summerfield St
- 630 Maple St
- 434 Linden St Unit 2
- 286 Grove St
- 1017 Pine St
- 45 Read St
- 609 Cherry St
- 119-121 Tremont St
- 65-67 Farnham St
- 540 Cherry St Unit 1
- 90 Tremont St
- 364 High St
- 216 Prospect St
- 362 High St
- 511 Bank St
- 485 Rock St
- 464 Bank St Unit 10
- 15 Shawmut St
- 888 Maple St Unit 2E
- 888 Maple St Unit AB
- 888 Maple St
- 928 Maple St
- 12 Shawmut St
- 29 Shawmut St
- 870 Maple St Unit 5
- 870 Maple St Unit 4
- 870 Maple St Unit 3
- 870 Maple St Unit 2
- 870 Maple St Unit 1
- 927 Maple St
- 32 Stetson St
- 45 Shawmut St
- 513 Robeson St
- 513 Robeson St Unit 2 South
- 46-48 Shawmut St
- 485 Robeson St
- 485 Robeson St Unit 2
Ask me questions while you tour the home.