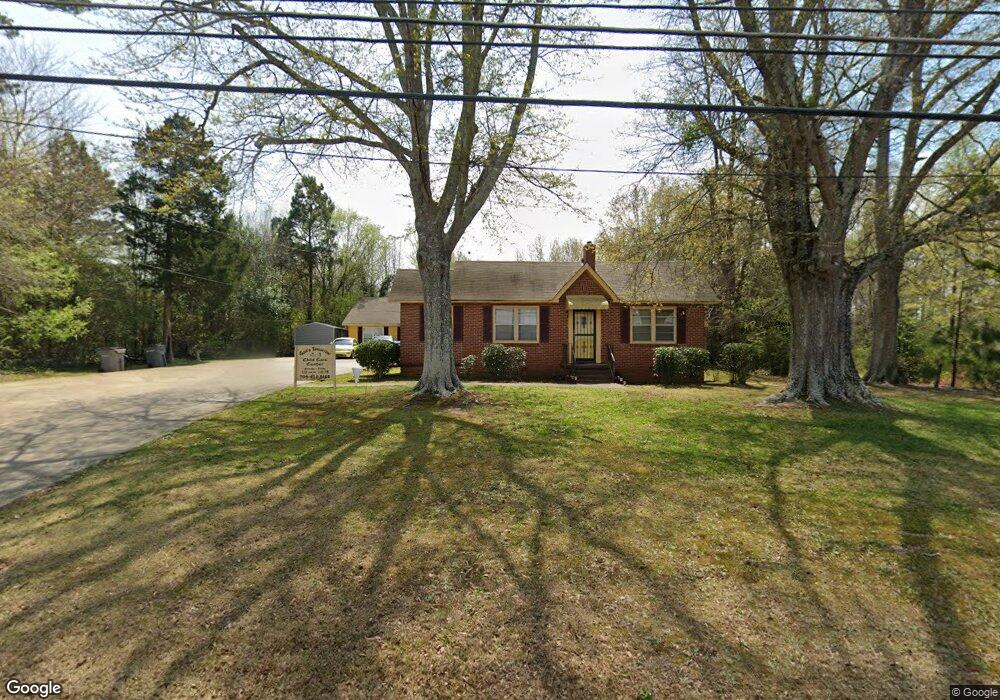
916 Colquitt St Lagrange, GA 30241
Estimated Value: $171,000
3
Beds
1
Bath
3,437
Sq Ft
$50/Sq Ft
Est. Value
About This Home
This home is located at 916 Colquitt St, Lagrange, GA 30241 and is currently priced at $171,000, approximately $49 per square foot. 916 Colquitt St is a home located in Troup County with nearby schools including Callaway Elementary School, Hogansville Elementary School, and Callaway Middle School.
Ownership History
Date
Name
Owned For
Owner Type
Purchase Details
Closed on
Mar 9, 2024
Sold by
Glanton Sharon
Bought by
Gods Tomorrow Inc
Current Estimated Value
Purchase Details
Closed on
Oct 16, 2023
Sold by
Glanton Winston E
Bought by
Glanton Sharon J
Purchase Details
Closed on
Sep 20, 2000
Sold by
Sharon Estes
Bought by
Glanton Sharon J and Glanton Winston E
Purchase Details
Closed on
Apr 9, 1984
Sold by
Truman Estes
Bought by
Sharon Estes
Purchase Details
Closed on
Jan 1, 1981
Sold by
Colleen F Zamor
Bought by
Truman Estes
Purchase Details
Closed on
Apr 15, 1980
Sold by
Robert F Zamor
Bought by
Colleen F Zamor
Purchase Details
Closed on
Oct 1, 1976
Sold by
Louie Mcclung
Bought by
Robert F Zamor
Purchase Details
Closed on
Mar 1, 1970
Sold by
Dorothy James B and Dorothy Hodnett
Bought by
Louie Mcclung
Purchase Details
Closed on
Jan 1, 1956
Sold by
Beth Sam M and Beth Blackman
Bought by
Dorothy James B and Dorothy Hodnett
Create a Home Valuation Report for This Property
The Home Valuation Report is an in-depth analysis detailing your home's value as well as a comparison with similar homes in the area
Purchase History
| Date | Buyer | Sale Price | Title Company |
|---|---|---|---|
| Gods Tomorrow Inc | -- | -- | |
| Glanton Sharon J | -- | -- | |
| Glanton Sharon J | -- | -- | |
| Sharon Estes | -- | -- | |
| Truman Estes | -- | -- | |
| Colleen F Zamor | -- | -- | |
| Robert F Zamor | -- | -- | |
| Louie Mcclung | -- | -- | |
| Dorothy James B | -- | -- |
Source: Public Records
Tax History
| Year | Tax Paid | Tax Assessment Tax Assessment Total Assessment is a certain percentage of the fair market value that is determined by local assessors to be the total taxable value of land and additions on the property. | Land | Improvement |
|---|---|---|---|---|
| 2025 | $3,452 | $126,556 | $6,960 | $119,596 |
| 2024 | $2,955 | $110,324 | $6,960 | $103,364 |
| 2023 | $2,248 | $2,762 | $0 | $2,762 |
| 2022 | $2,648 | $96,848 | $6,960 | $89,888 |
| 2021 | $2,425 | $82,380 | $6,960 | $75,420 |
| 2020 | $2,425 | $82,380 | $6,960 | $75,420 |
| 2019 | $2,457 | $83,468 | $6,960 | $76,508 |
| 2018 | $2,436 | $82,758 | $6,250 | $76,508 |
| 2017 | $2,436 | $82,758 | $6,250 | $76,508 |
| 2016 | $2,435 | $82,719 | $6,250 | $76,469 |
| 2015 | $2,461 | $83,448 | $6,979 | $76,469 |
| 2014 | $2,354 | $79,780 | $5,552 | $74,228 |
| 2013 | -- | $79,780 | $5,552 | $74,228 |
Source: Public Records
Map
Nearby Homes
- 319 Cooley Rd
- 459 Merrywood Dr
- 957 Kelley St
- 0 Kelley St Unit 10550311
- 1017 Mason St
- 0 Mason St Unit E102667
- 1604 S Davis Rd
- 137 Edgewood Ave
- LOT 15 Edgewood Ave
- 114 Edgewood Ave
- 428 Macon St
- 0 Upper Big Springs Rd Unit 10545622
- 626 Smoot St
- 510 Smoot St
- 213 Euclid Ave
- 216 Euclid Ave
- 0 Lanett Ave
- 0 Brown St Unit 10550761
- 0 Brown St Unit 10550754
- 130 Edgewood Ave
- 922 Colquitt St
- 924 Colquitt St
- 920 Colquitt St
- 918 Colquitt St
- 104 Cooley Rd
- 912 Colquitt St
- 923 Arizona St Unit A
- 923 Arizona St
- 106 Cooley Rd
- 1000 Colquitt St
- 919A Arizona St Unit B
- 1002 Colquitt St
- 910 Colquitt St
- 1001 Colquitt St
- 202 Cooley Rd
- 926 Arizona St
- 922 Arizona St
- 924 Arizona St
- 917 Arizona St Unit B
- 105 Cooley Rd
Your Personal Tour Guide
Ask me questions while you tour the home.