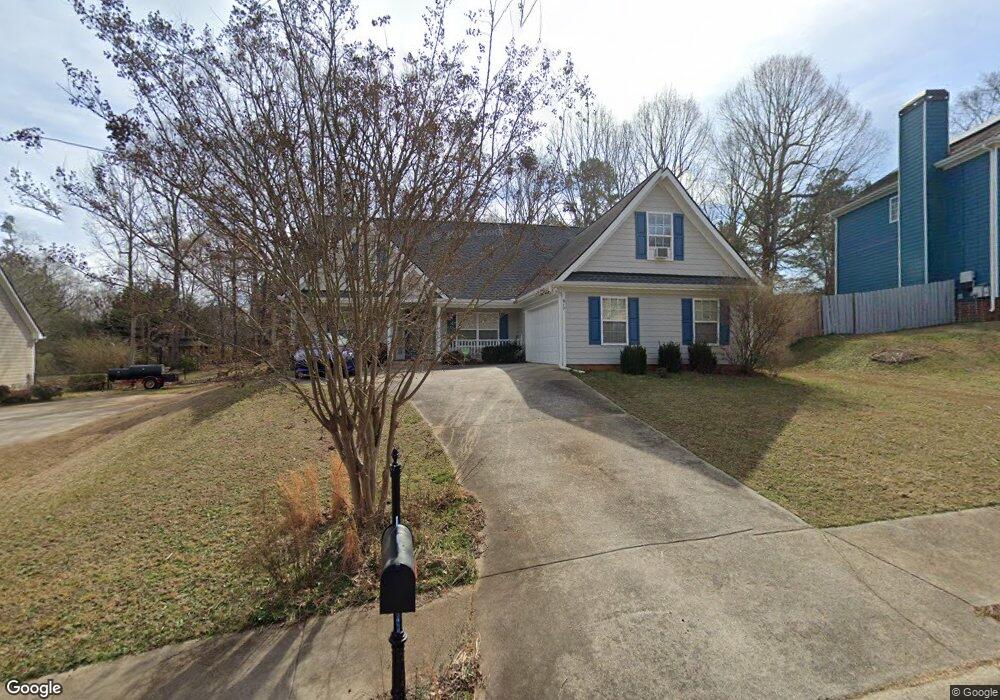
917 Daisy Ln Athens, GA 30605
Athens AreaEstimated Value: $370,260 - $396,000
About This Home
This home is located at 917 Daisy Ln, Athens, GA 30605 and is currently estimated at $382,315, approximately $204 per square foot. 917 Daisy Ln is a home located in Clarke County with nearby schools including Whit Davis Road Elementary School, Hilsman Middle School, and Cedar Shoals High School.
Ownership History
We collect this data history from publicly available records. To have your information removed, we recommend requesting removal directly through your county’s website.
Purchase Details
Home Financials for this Owner
Home Financials are based on the most recent Mortgage that was taken out on this home.Purchase Details
Home Financials for this Owner
Home Financials are based on the most recent Mortgage that was taken out on this home.Purchase Details
Purchase Details
Purchase Details
Purchase History
We collect this data history from publicly available records. To have your information removed, we recommend requesting removal directly through your county’s website.
| Date | Buyer | Sale Price | Title Company |
|---|---|---|---|
| $192,155 | -- | ||
| $143,900 | -- | ||
| $151,900 | -- | ||
| $32,500 | -- | ||
| $29,500 | -- |
Mortgage History
We collect this data history from publicly available records. To have your information removed, we recommend requesting removal directly through your county’s website.
| Date | Status | Borrower | Loan Amount |
|---|---|---|---|
| Open | $182,545 | ||
| Closed | $182,545 | ||
| Previous Owner | $141,293 | ||
| Previous Owner | $15,850 |
Tax History
We collect this data history from publicly available records. To have your information removed, we recommend requesting removal directly through your county’s website.
| Year | Tax Paid | Tax Assessment Tax Assessment Total Assessment is a certain percentage of the fair market value that is determined by local assessors to be the total taxable value of land and additions on the property. | Land | Improvement |
|---|---|---|---|---|
| 2025 | $3,778 | $143,330 | $12,000 | $131,330 |
| 2024 | $3,778 | $128,823 | $12,000 | $116,823 |
| 2023 | $3,526 | $121,101 | $12,000 | $109,101 |
| 2022 | $2,972 | $103,175 | $12,000 | $91,175 |
| 2021 | $2,779 | $92,454 | $12,000 | $80,454 |
| 2020 | $2,533 | $85,156 | $12,000 | $73,156 |
| 2019 | $2,366 | $79,676 | $12,000 | $67,676 |
| 2018 | $2,162 | $73,676 | $12,000 | $61,676 |
| 2017 | $1,940 | $67,131 | $12,000 | $55,131 |
| 2016 | $1,735 | $61,110 | $12,000 | $49,110 |
| 2015 | $1,706 | $60,168 | $12,000 | $48,168 |
| 2014 | $1,676 | $59,194 | $12,000 | $47,194 |
Map
- 768 Weeping Willow Dr
- 602 Trellis Ct
- 127 Bordeaux Ln
- 281 Timber Creek Dr
- 140 Wendy Ln
- 181 Elderberry Cir
- 520 Charles Dr Lot 18
- 201 Ridge Run Crossing
- 1850 Cedar Shoals Dr Unit A3
- 515 Charles Dr Lot 20
- 510 Charles Dr Lot 17
- 505 Charles Dr Lot 21
- 570 Cedar Creek Dr
- 500 Charles Dr Lot 16
- 180 Timber Creek Dr
- 245 Morris Way Unit LOT 10
- 465 Charles Dr Lot 6
- 245
- 455 Charles Dr Lot 5
- 460 Charles Dr Unit LOT 8
- 749 Weeping Willow Dr
- 757 Weeping Willow Dr
- 741 Weeping Willow Dr
- 925 Daisy Ln
- 765 Weeping Willow Dr
- 733 Weeping Willow Dr
- 921 Daisy Ln
- 752 Weeping Willow Dr
- 748 Weeping Willow Dr
- 110 Hummingbird Trail
- 756 Weeping Willow Dr
- 744 Weeping Willow Dr
- 929 Daisy Ln
- 760 Weeping Willow Dr
- 760 Weeping Willow Dr
- 769 Weeping Willow Dr
- 740 Weeping Willow Dr
- 913 Daisy Ln
- 736 Weeping Willow Dr
- 764 Weeping Willow Dr
Ask me questions while you tour the home.