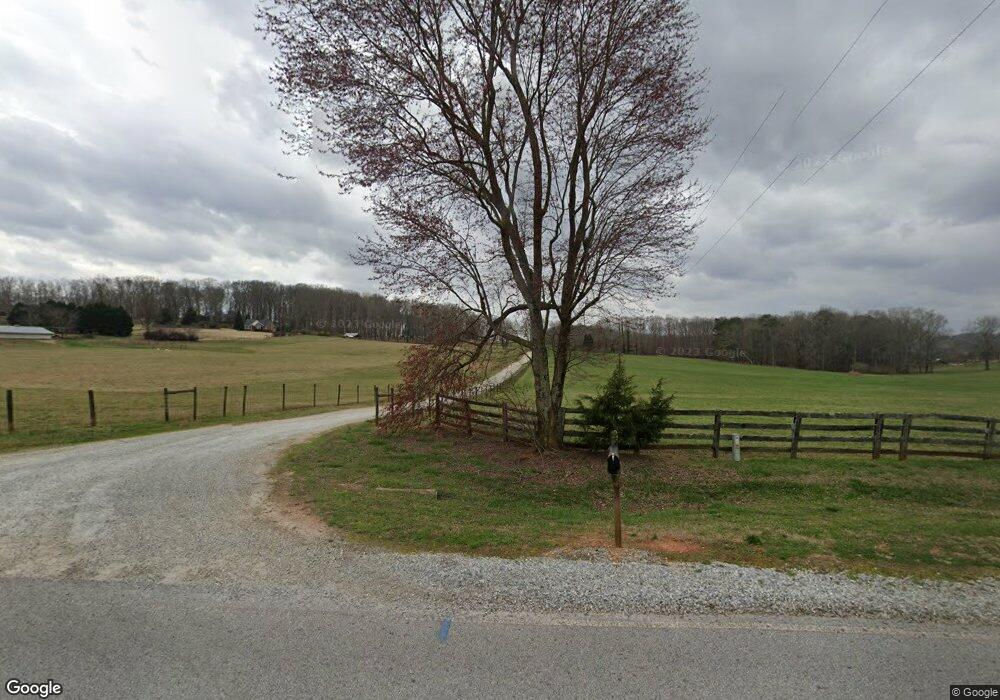
918 Brockton Loop Jefferson, GA 30549
Estimated Value: $431,000 - $1,597,646
3
Beds
2
Baths
2,261
Sq Ft
$532/Sq Ft
Est. Value
About This Home
This home is located at 918 Brockton Loop, Jefferson, GA 30549 and is currently estimated at $1,202,549, approximately $531 per square foot. 918 Brockton Loop is a home located in Jackson County with nearby schools including South Jackson Elementary School, East Jackson Middle School, and East Jackson Comprehensive High School.
Ownership History
Date
Name
Owned For
Owner Type
Purchase Details
Closed on
Oct 2, 2017
Sold by
Martin Misty
Bought by
Garmon Jones T
Current Estimated Value
Purchase Details
Closed on
Aug 21, 2013
Sold by
Martin Misty G
Bought by
Martin Misty G
Purchase Details
Closed on
Oct 12, 2011
Sold by
Garmon Jones T
Bought by
Martin Misty G
Purchase Details
Closed on
Jul 6, 2007
Sold by
Not Provided
Bought by
Garmon Jones T
Purchase Details
Closed on
Nov 10, 1998
Sold by
Garmon Jones T
Bought by
Garmon Jones T and Garmon Sus
Create a Home Valuation Report for This Property
The Home Valuation Report is an in-depth analysis detailing your home's value as well as a comparison with similar homes in the area
Home Values in the Area
Average Home Value in this Area
Purchase History
| Date | Buyer | Sale Price | Title Company |
|---|---|---|---|
| Garmon Jones T | -- | -- | |
| Martin Misty G | -- | -- | |
| Martin Misty G | -- | -- | |
| Garmon Jones T | -- | -- | |
| Garmon Jones T | -- | -- |
Source: Public Records
Tax History
| Year | Tax Paid | Tax Assessment Tax Assessment Total Assessment is a certain percentage of the fair market value that is determined by local assessors to be the total taxable value of land and additions on the property. | Land | Improvement |
|---|---|---|---|---|
| 2025 | $1,635 | $286,540 | $200,200 | $86,340 |
| 2024 | $1,635 | $286,540 | $200,200 | $86,340 |
| 2023 | $3,189 | $276,260 | $200,200 | $76,060 |
| 2022 | $2,655 | $158,980 | $98,680 | $60,300 |
| 2021 | $2,533 | $158,860 | $98,560 | $60,300 |
| 2020 | $2,395 | $147,860 | $98,560 | $49,300 |
| 2019 | $2,408 | $147,860 | $98,560 | $49,300 |
| 2018 | $2,536 | $151,440 | $98,560 | $52,880 |
| 2017 | $2,412 | $153,080 | $103,938 | $49,142 |
| 2016 | $2,408 | $153,080 | $103,938 | $49,142 |
| 2015 | $2,396 | $153,080 | $103,938 | $49,142 |
| 2014 | $2,223 | $148,002 | $103,938 | $44,064 |
| 2013 | -- | $144,172 | $103,938 | $40,234 |
Source: Public Records
Map
Nearby Homes
- 918 Brockton Loop
- 1601 Cedarwood Dr
- 39 Gray Field Ct
- 1123 Poppy Ln
- 2000 Oconee River Drive Lot 10
- 0 Brockton Loop Unit 2 & 3
- 175 Still Water Ln
- 311 Webb Meadows Dr
- 4107 Jefferson River Rd
- 363 Psalms Dr
- 37 Hometown Ct
- 223 Azalea Dr
- 176 Whitetail Trail
- 386 Red Dragon Dr
- 246 Emmaline Ln
- 103 Dewitt Dr
- 726 Peachtree Rd
- 939 Canter Way
- 924 Brockton Rd
- 538 Davis Rd
- 918 Brockton Loop Rd
- 1120 Brockton Loop
- 1120 Brockton Loop
- 1124 Brockton Loop
- 1094 Brockton Loop
- 826 Brockton Loop
- 826 Brockton Loop
- 1038 Brockton Loop
- 1178 Brockton Loop
- 760 Brockton Loop
- 694 Brockton Loop
- 1289 Poppy Ln
- 169 Grandview Dr Unit 24
- 189 Grandview Dr
- 327 Grandview Dr
- 151 Grandview Dr Unit 25
- 151 Grandview Dr
- 82 Gray Field Ct
- 207 Grandview Dr
- 74 Gray Field Ct
Your Personal Tour Guide
Ask me questions while you tour the home.