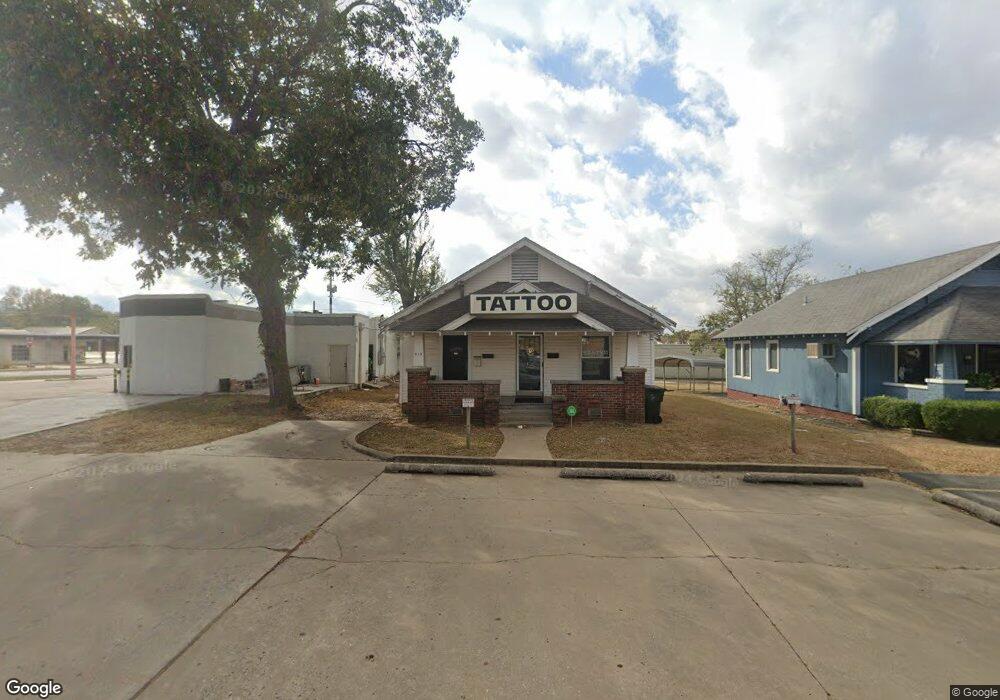
918 E 7th St Okmulgee, OK 74447
Estimated Value: $57,314 - $136,000
2
Beds
1
Bath
1,122
Sq Ft
$71/Sq Ft
Est. Value
About This Home
This home is located at 918 E 7th St, Okmulgee, OK 74447 and is currently estimated at $79,329, approximately $70 per square foot. 918 E 7th St is a home located in Okmulgee County with nearby schools including Okmulgee Primary School, Dunbar Elementary School, and Okmulgee Middle School.
Ownership History
Date
Name
Owned For
Owner Type
Purchase Details
Closed on
Jan 21, 2015
Sold by
Osterman William F and Osterman Brenda
Bought by
Weatherford Randy L and Weatherford Julie E
Current Estimated Value
Home Financials for this Owner
Home Financials are based on the most recent Mortgage that was taken out on this home.
Original Mortgage
$33,976
Interest Rate
3.83%
Mortgage Type
Future Advance Clause Open End Mortgage
Purchase Details
Closed on
Nov 20, 2008
Sold by
Osterman Connie L
Bought by
Osterman William F
Purchase Details
Closed on
Jun 16, 1995
Sold by
Charles Birtcil
Bought by
Wm Osterman
Create a Home Valuation Report for This Property
The Home Valuation Report is an in-depth analysis detailing your home's value as well as a comparison with similar homes in the area
Home Values in the Area
Average Home Value in this Area
Purchase History
| Date | Buyer | Sale Price | Title Company |
|---|---|---|---|
| Weatherford Randy L | $33,000 | None Available | |
| Osterman William F | -- | None Available | |
| Bilcon Investments Inc | -- | None Available | |
| Wm Osterman | $38,000 | -- |
Source: Public Records
Mortgage History
| Date | Status | Borrower | Loan Amount |
|---|---|---|---|
| Closed | Weatherford Randy L | $33,976 |
Source: Public Records
Tax History
| Year | Tax Paid | Tax Assessment Tax Assessment Total Assessment is a certain percentage of the fair market value that is determined by local assessors to be the total taxable value of land and additions on the property. | Land | Improvement |
|---|---|---|---|---|
| 2025 | $333 | $3,643 | $180 | $3,463 |
| 2024 | $314 | $3,469 | $180 | $3,289 |
| 2023 | $318 | $3,742 | $180 | $3,562 |
| 2022 | $315 | $3,720 | $180 | $3,540 |
| 2021 | $313 | $3,720 | $180 | $3,540 |
| 2020 | $299 | $3,375 | $180 | $3,195 |
| 2019 | $284 | $3,214 | $180 | $3,034 |
| 2018 | $274 | $3,061 | $180 | $2,881 |
| 2017 | $258 | $2,915 | $180 | $2,735 |
| 2016 | $283 | $3,191 | $180 | $3,011 |
| 2015 | $214 | $2,486 | $113 | $2,373 |
| 2014 | $205 | $2,368 | $138 | $2,230 |
Source: Public Records
Map
Nearby Homes
- 200 S Wood Dr
- 900 E 7th St
- 130 S Wood Dr
- 905 E 7th St
- 706 S Choctaw Ave
- 1009 E 8th St
- 200 S Choctaw Ave
- 1014 E 7th St
- 916 E 8th St
- 908 E 6th St
- 6 E Southbrook Ave
- 204 S Osage Ave
- 202 S Osage Ave
- 210 S Osage Ave
- 0 E 20th St Unit 1828431
- 1009 E 6th St
- 911 E 9th St
- 901 E 9th E Hwy 75 St Unit 901
- 320 S Wood Dr
- 1024 E 6th St
Your Personal Tour Guide
Ask me questions while you tour the home.