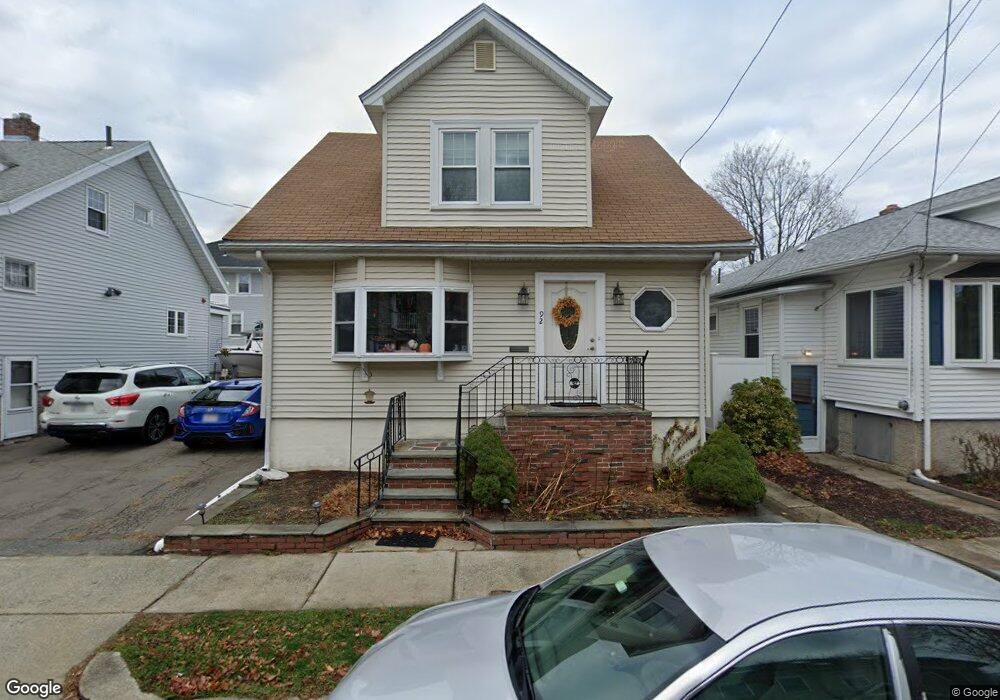
92 Colby Rd Quincy, MA 02171
North Quincy NeighborhoodEstimated Value: $704,000 - $736,000
3
Beds
2
Baths
1,415
Sq Ft
$508/Sq Ft
Est. Value
About This Home
This home is located at 92 Colby Rd, Quincy, MA 02171 and is currently estimated at $718,417, approximately $507 per square foot. 92 Colby Rd is a home located in Norfolk County with nearby schools including Francis W. Parker Elementary School, Atlantic Middle School, and North Quincy High School.
Ownership History
Date
Name
Owned For
Owner Type
Purchase Details
Closed on
Sep 29, 2014
Sold by
Anderson Brian C and Anderson Christine M
Bought by
Anderson Brian C
Current Estimated Value
Purchase Details
Closed on
Feb 14, 2011
Sold by
Pierce Gail
Bought by
Anderson Brian C and Anderson Christine M
Home Financials for this Owner
Home Financials are based on the most recent Mortgage that was taken out on this home.
Original Mortgage
$332,500
Interest Rate
4.88%
Mortgage Type
Purchase Money Mortgage
Purchase Details
Closed on
Jul 31, 2003
Sold by
Phelan William S and Phelan Mary C
Bought by
Pierce Gail
Home Financials for this Owner
Home Financials are based on the most recent Mortgage that was taken out on this home.
Original Mortgage
$284,000
Interest Rate
5.28%
Mortgage Type
Purchase Money Mortgage
Create a Home Valuation Report for This Property
The Home Valuation Report is an in-depth analysis detailing your home's value as well as a comparison with similar homes in the area
Home Values in the Area
Average Home Value in this Area
Purchase History
| Date | Buyer | Sale Price | Title Company |
|---|---|---|---|
| Anderson Brian C | -- | -- | |
| Anderson Brian C | $350,000 | -- | |
| Pierce Gail | $355,000 | -- |
Source: Public Records
Mortgage History
| Date | Status | Borrower | Loan Amount |
|---|---|---|---|
| Previous Owner | Anderson Brian C | $332,500 | |
| Previous Owner | Pierce Gail | $284,000 |
Source: Public Records
Tax History
| Year | Tax Paid | Tax Assessment Tax Assessment Total Assessment is a certain percentage of the fair market value that is determined by local assessors to be the total taxable value of land and additions on the property. | Land | Improvement |
|---|---|---|---|---|
| 2025 | $6,737 | $584,300 | $329,600 | $254,700 |
| 2024 | $6,560 | $582,100 | $329,600 | $252,500 |
| 2023 | $6,281 | $564,300 | $299,600 | $264,700 |
| 2022 | $5,903 | $492,700 | $239,700 | $253,000 |
| 2021 | $5,799 | $477,700 | $239,700 | $238,000 |
| 2020 | $5,709 | $459,300 | $235,000 | $224,300 |
| 2019 | $5,317 | $423,700 | $226,000 | $197,700 |
| 2018 | $5,403 | $405,000 | $215,200 | $189,800 |
| 2017 | $5,335 | $376,500 | $195,600 | $180,900 |
| 2016 | $5,115 | $356,200 | $177,900 | $178,300 |
| 2015 | $4,653 | $318,700 | $161,700 | $157,000 |
| 2014 | $4,489 | $302,100 | $161,700 | $140,400 |
Source: Public Records
Map
Nearby Homes
- 27 Herbert Rd
- 297 Billings St
- 25 Webster St
- 135 E Squantum St
- 271 Atlantic St
- 201 Billings St
- 4 Edwin St
- 153 Vassall St
- 85 E Squantum St Unit 10
- 228 Atlantic St
- 175 Quincy Shore Dr Unit B23
- 212 Quincy Shore Dr
- 17 Holmes St Unit 2
- 11 Gould St
- 20 Ellington Rd
- 138 Quincy Shore Dr Unit 170
- 150 Hancock St Unit 101
- 142 Quincy Shore Dr Unit 142
- 90 Quincy Shore Dr Unit 803
- 90 Quincy Shore Dr Unit 501
Your Personal Tour Guide
Ask me questions while you tour the home.