92 Gallway St Warwick, RI 02889
Hoxie NeighborhoodEstimated Value: $366,000 - $404,000
About This Home
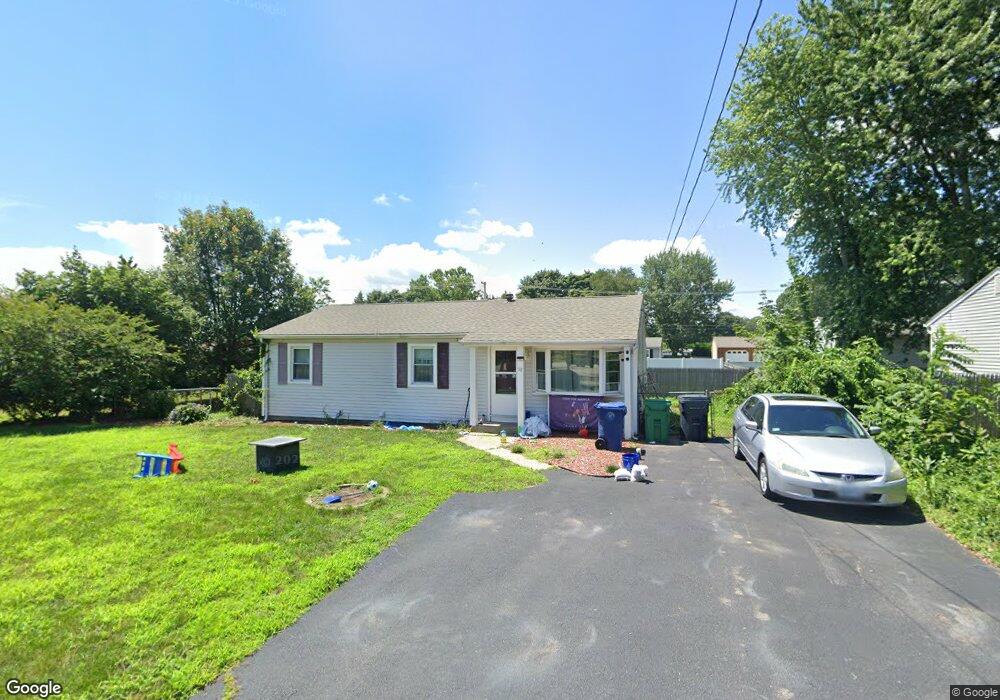
This home is located at 92 Gallway St, Warwick, RI 02889 and is currently estimated at $387,364, approximately $403 per square foot. 92 Gallway St is a home located in Kent County with nearby schools including St Rose Of Lima School and Saint Kevin School.
Ownership History
We collect this data history from publicly available records. To have your information removed, we recommend requesting removal directly through your county’s website.
Purchase Details
Home Financials for this Owner
Home Financials are based on the most recent Mortgage that was taken out on this home.Purchase Details
Home Financials for this Owner
Home Financials are based on the most recent Mortgage that was taken out on this home.Purchase Details
Home Financials for this Owner
Home Financials are based on the most recent Mortgage that was taken out on this home.Purchase Details
Home Values in the Area
Average Home Value in this Area
Purchase History
We collect this data history from publicly available records. To have your information removed, we recommend requesting removal directly through your county’s website.
| Date | Buyer | Sale Price | Title Company |
|---|---|---|---|
| $220,000 | None Available | ||
| -- | -- | ||
| $162,500 | -- | ||
| $102,000 | -- | ||
| $102,000 | -- |
Mortgage History
We collect this data history from publicly available records. To have your information removed, we recommend requesting removal directly through your county’s website.
| Date | Status | Borrower | Loan Amount |
|---|---|---|---|
| Open | $216,015 | ||
| Previous Owner | $165,649 | ||
| Previous Owner | $159,989 | ||
| Previous Owner | $190,000 | ||
| Previous Owner | $135,000 |
Tax History
We collect this data history from publicly available records. To have your information removed, we recommend requesting removal directly through your county’s website.
| Year | Tax Paid | Tax Assessment Tax Assessment Total Assessment is a certain percentage of the fair market value that is determined by local assessors to be the total taxable value of land and additions on the property. | Land | Improvement |
|---|---|---|---|---|
| 2025 | $4,279 | $336,900 | $102,700 | $234,200 |
| 2024 | $4,102 | $283,500 | $84,800 | $198,700 |
| 2023 | $4,023 | $283,500 | $84,800 | $198,700 |
| 2022 | $3,722 | $198,700 | $51,900 | $146,800 |
| 2021 | $3,493 | $186,500 | $51,900 | $134,600 |
| 2020 | $3,493 | $186,500 | $51,900 | $134,600 |
| 2019 | $3,493 | $186,500 | $51,900 | $134,600 |
| 2018 | $2,759 | $136,300 | $49,000 | $87,300 |
| 2017 | $2,759 | $136,300 | $49,000 | $87,300 |
| 2016 | $2,759 | $136,300 | $49,000 | $87,300 |
| 2015 | $2,882 | $138,900 | $56,700 | $82,200 |
| 2014 | $2,786 | $138,900 | $56,700 | $82,200 |
| 2013 | $2,749 | $138,900 | $56,700 | $82,200 |
Map
- 190 Pinnery Ave
- 211 Pinnery Ave
- 64 Ormsby Ave
- 70 Turner St Unit A-3
- 70 Turner St Unit E-8
- 70 Turner St Unit D-2
- 53 Norfolk Rd
- 23 Perkins St
- 110 Marigold Dr
- 143 Endicott Dr
- 14 Stone Ave
- 78 Shand Ave
- 109 Pinegrove Ave
- 45 Haven St
- 7 Parkway Dr
- 700 Sandy Ln Unit 3
- 700 Sandy Ln Unit 5
- 700 Sandy Ln Unit 19
- 700 Sandy Ln Unit 20
- 700 Sandy Ln Unit 2
Ask me questions while you tour the home.