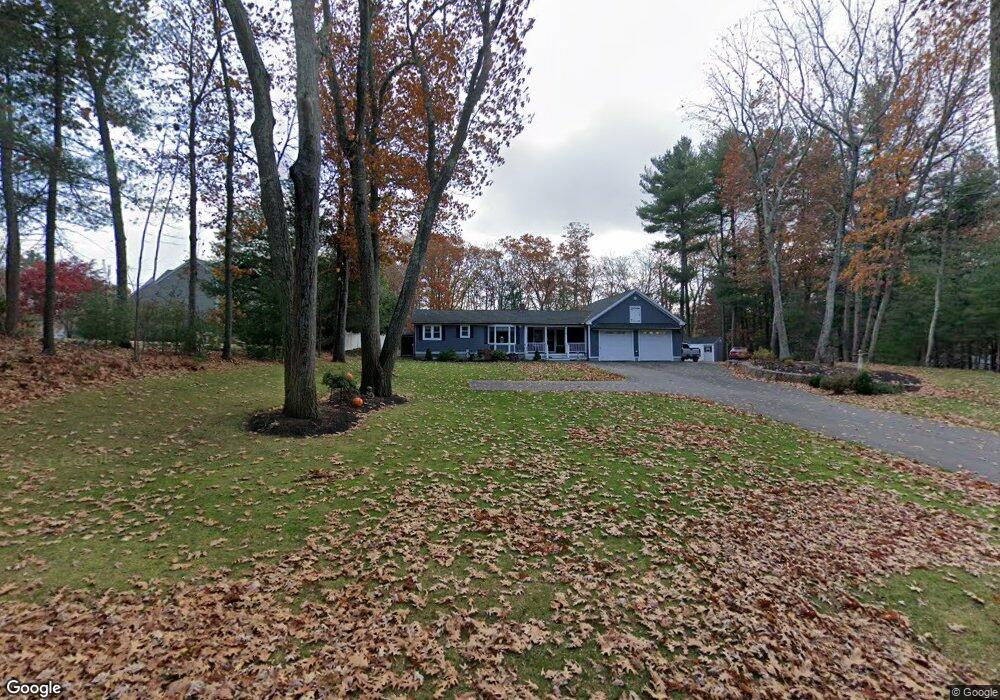
92 River St Middleton, MA 01949
Estimated Value: $744,952 - $982,000
2
Beds
1
Bath
1,083
Sq Ft
$754/Sq Ft
Est. Value
About This Home
This home is located at 92 River St, Middleton, MA 01949 and is currently estimated at $816,738, approximately $754 per square foot. 92 River St is a home located in Essex County with nearby schools including Howe-Manning Elementary School, Fuller Meadow Elementary School, and Masconomet Regional Middle School.
Ownership History
Date
Name
Owned For
Owner Type
Purchase Details
Closed on
Jul 1, 2016
Sold by
Taibbi Joseph
Bought by
Lever Paul E and Lever Evelyn M
Current Estimated Value
Purchase Details
Closed on
Nov 19, 2008
Sold by
Dorothy L Whitten T and Whitten Dorothy L
Bought by
Taibbi Joseph and Taibbi Joseph F
Home Financials for this Owner
Home Financials are based on the most recent Mortgage that was taken out on this home.
Original Mortgage
$228,000
Interest Rate
6.03%
Mortgage Type
Purchase Money Mortgage
Create a Home Valuation Report for This Property
The Home Valuation Report is an in-depth analysis detailing your home's value as well as a comparison with similar homes in the area
Home Values in the Area
Average Home Value in this Area
Purchase History
We collect this data history from publicly available records. To have your information removed, we recommend requesting removal directly through your county’s website.
| Date | Buyer | Sale Price | Title Company |
|---|---|---|---|
| Lever Paul E | $485,000 | -- | |
| Lever Paul E | $485,000 | -- | |
| Taibbi Joseph | $285,000 | -- | |
| Taibbi Joseph | $285,000 | -- |
Source: Public Records
Mortgage History
We collect this data history from publicly available records. To have your information removed, we recommend requesting removal directly through your county’s website.
| Date | Status | Borrower | Loan Amount |
|---|---|---|---|
| Previous Owner | Taibbi Joseph | $207,000 | |
| Previous Owner | Taibbi Joseph | $230,000 | |
| Previous Owner | Taibbi Joseph | $228,000 |
Source: Public Records
Tax History
| Year | Tax Paid | Tax Assessment Tax Assessment Total Assessment is a certain percentage of the fair market value that is determined by local assessors to be the total taxable value of land and additions on the property. | Land | Improvement |
|---|---|---|---|---|
| 2025 | $7,909 | $665,200 | $352,500 | $312,700 |
| 2024 | $8,161 | $692,200 | $352,500 | $339,700 |
| 2023 | $7,488 | $581,800 | $352,500 | $229,300 |
| 2022 | $7,794 | $588,200 | $317,300 | $270,900 |
| 2021 | $7,407 | $539,900 | $283,300 | $256,600 |
| 2020 | $7,146 | $524,700 | $259,300 | $265,400 |
| 2019 | $7,009 | $512,000 | $267,300 | $244,700 |
| 2018 | $6,563 | $470,100 | $263,300 | $206,800 |
| 2017 | $5,510 | $395,000 | $233,300 | $161,700 |
| 2016 | $5,005 | $360,300 | $203,700 | $156,600 |
| 2015 | $4,698 | $340,900 | $207,700 | $133,200 |
Source: Public Records
Map
Nearby Homes
- 12 Couture Way
- 16 Couture Way
- 43 Hampshire Rd
- 111 Flint Farm Rd
- 68 Birch St
- 3 Maryvale Ln
- 10 Brookbridge Rd
- 6 Phaneuf St
- 8 Edgewood Rd
- 360 Andover St Unit 1310
- 60 Catherine Dr
- 43 Riverside Dr
- 7 Wedge Ct Unit 7
- 1 East St
- 10 Fairway Ln
- 4 Lowell St
- 15 Rowell Ln Unit 15
- 43 Perley Ave
- 23 Herrick Rd
- 98 Newbury St Unit 18B
Your Personal Tour Guide
Ask me questions while you tour the home.