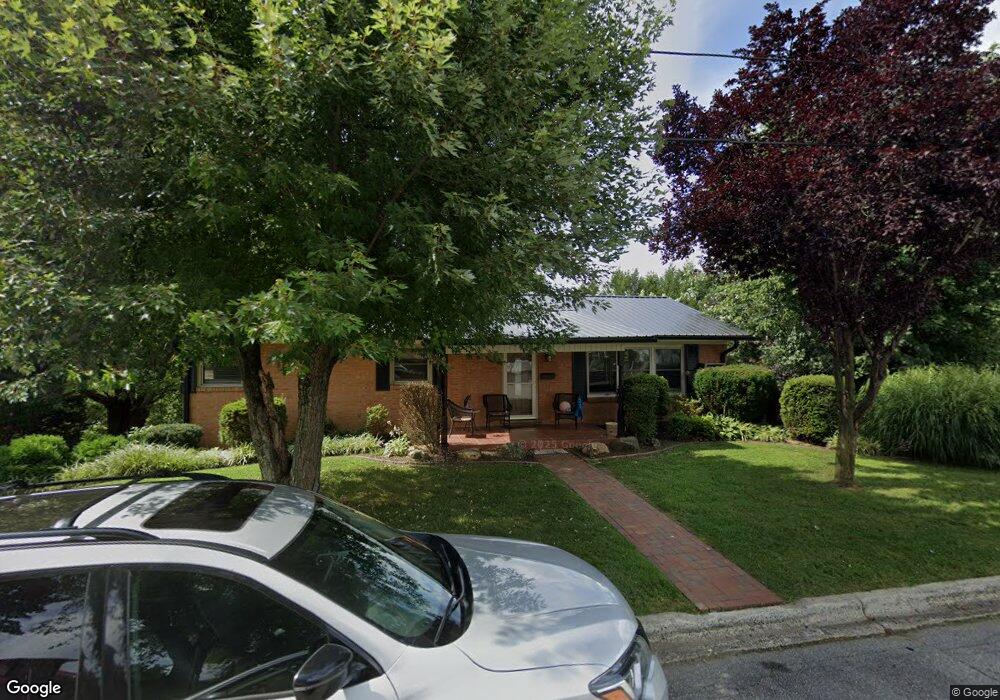
92 Wesley St Canton, NC 28716
Estimated Value: $282,000 - $345,000
3
Beds
2
Baths
1,144
Sq Ft
$263/Sq Ft
Est. Value
About This Home
This home is located at 92 Wesley St, Canton, NC 28716 and is currently estimated at $301,169, approximately $263 per square foot. 92 Wesley St is a home located in Haywood County with nearby schools including Meadowbrook Elementary School, Canton Middle, and Pisgah High School.
Ownership History
Date
Name
Owned For
Owner Type
Purchase Details
Closed on
Nov 5, 2021
Sold by
Mann Jeffrey and Mann Brenda
Bought by
Clark Kelly Palmer
Current Estimated Value
Home Financials for this Owner
Home Financials are based on the most recent Mortgage that was taken out on this home.
Original Mortgage
$205,000
Outstanding Balance
$188,261
Interest Rate
3.15%
Mortgage Type
New Conventional
Estimated Equity
$112,908
Purchase Details
Closed on
Sep 7, 1995
Bought by
Justice Diane Q
Create a Home Valuation Report for This Property
The Home Valuation Report is an in-depth analysis detailing your home's value as well as a comparison with similar homes in the area
Home Values in the Area
Average Home Value in this Area
Purchase History
| Date | Buyer | Sale Price | Title Company |
|---|---|---|---|
| Clark Kelly Palmer | $205,000 | None Available | |
| Justice Diane Q | $55,400 | -- |
Source: Public Records
Mortgage History
| Date | Status | Borrower | Loan Amount |
|---|---|---|---|
| Open | Clark Kelly Palmer | $205,000 |
Source: Public Records
Tax History
| Year | Tax Paid | Tax Assessment Tax Assessment Total Assessment is a certain percentage of the fair market value that is determined by local assessors to be the total taxable value of land and additions on the property. | Land | Improvement |
|---|---|---|---|---|
| 2025 | -- | $199,200 | $24,700 | $174,500 |
| 2024 | $13 | $199,200 | $24,700 | $174,500 |
| 2023 | $1,255 | $199,200 | $24,700 | $174,500 |
| 2022 | $1,225 | $199,200 | $24,700 | $174,500 |
| 2021 | $1,225 | $199,200 | $24,700 | $174,500 |
| 2020 | $398 | $136,200 | $34,000 | $102,200 |
| 2019 | $398 | $136,200 | $34,000 | $102,200 |
| 2018 | $398 | $136,200 | $34,000 | $102,200 |
| 2017 | $398 | $136,200 | $0 | $0 |
| 2016 | $440 | $155,500 | $0 | $0 |
| 2015 | $1,044 | $155,500 | $0 | $0 |
| 2014 | $934 | $155,500 | $0 | $0 |
Source: Public Records
Map
Nearby Homes
- 355 Johnson Dr
- 51 Holtzclaw St
- 212 Holtzclaw St Unit PT 14-15
- 121 Johnson St
- 84 Wood Lily Dr
- 589 Pisgah Dr
- 00 Locust St
- 131 Skyline Dr Unit 31
- 163 Pharr St
- 28 Back Stage Pass
- 687 Holtzclaw Rd
- 130 Crestview St
- 146 Underwood Rd
- 1397 Dutch Cove Rd
- 318 Academy St
- 239 Northside St
- 36 Kimberly Dr
- 151 Hampton Heights Rd
- 1254 Pisgah Dr
- 172 Reed St
Your Personal Tour Guide
Ask me questions while you tour the home.