920 Main St Groveport, OH 43125
Estimated Value: $248,000 - $296,000
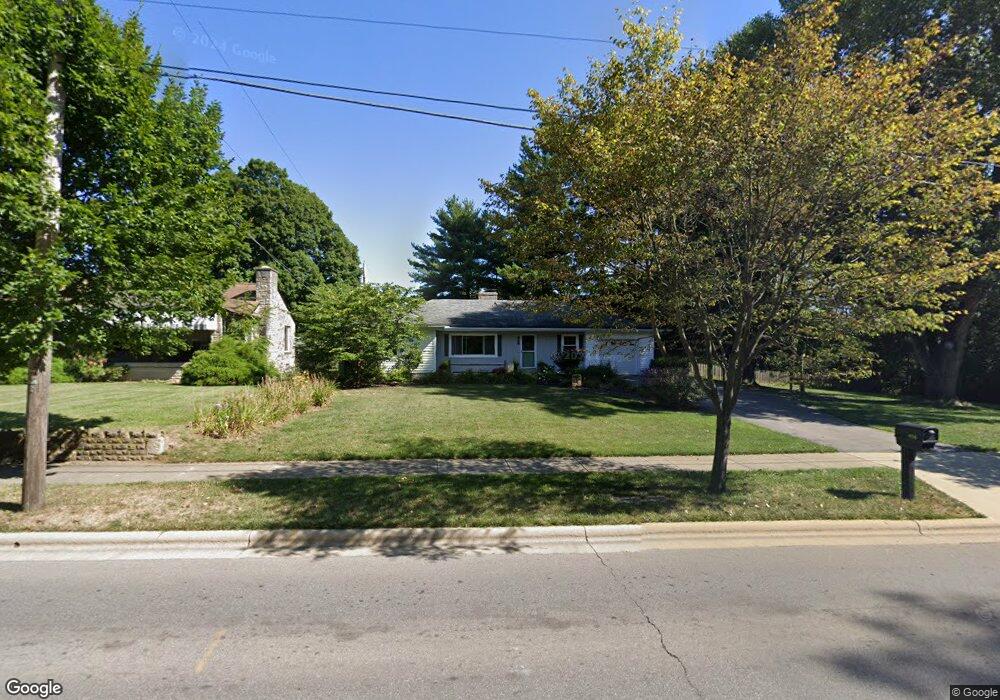
About This Home
This home is located at 920 Main St, Groveport, OH 43125 and is currently estimated at $275,729, approximately $220 per square foot. 920 Main St is a home located in Franklin County with nearby schools including Groveport Madison High School, Groveport Community School, and Madison Christian School.
Ownership History
We collect this data history from publicly available records. To have your information removed, we recommend requesting removal directly through your county’s website.
Purchase Details
Purchase Details
Purchase Details
Purchase Details
Home Values in the Area
Average Home Value in this Area
Purchase History
We collect this data history from publicly available records. To have your information removed, we recommend requesting removal directly through your county’s website.
| Date | Buyer | Sale Price | Title Company |
|---|---|---|---|
| $177,000 | Bridge T&E Svcs Llc | ||
| -- | None Available | ||
| -- | None Available | ||
| -- | -- |
Tax History
We collect this data history from publicly available records. To have your information removed, we recommend requesting removal directly through your county’s website.
| Year | Tax Paid | Tax Assessment Tax Assessment Total Assessment is a certain percentage of the fair market value that is determined by local assessors to be the total taxable value of land and additions on the property. | Land | Improvement |
|---|---|---|---|---|
| 2025 | $3,492 | $71,400 | $23,800 | $47,600 |
| 2024 | $3,492 | $71,400 | $23,800 | $47,600 |
| 2023 | $3,461 | $71,400 | $23,800 | $47,600 |
| 2022 | $3,798 | $62,510 | $16,730 | $45,780 |
| 2021 | $3,812 | $62,510 | $16,730 | $45,780 |
| 2020 | $3,821 | $62,510 | $16,730 | $45,780 |
| 2019 | $2,996 | $51,950 | $13,970 | $37,980 |
| 2018 | $2,765 | $51,950 | $13,970 | $37,980 |
| 2017 | $3,019 | $51,950 | $13,970 | $37,980 |
| 2016 | $2,495 | $41,170 | $11,170 | $30,000 |
| 2015 | $2,857 | $41,170 | $11,170 | $30,000 |
| 2014 | $2,369 | $41,170 | $11,170 | $30,000 |
| 2013 | $1,077 | $43,330 | $11,760 | $31,570 |
Map
- 213 Front St
- 131 Front St
- 131 Walnut St
- 525 Main St
- 518 Blacklick St
- 5907 Ebright Rd
- 463 Naomi Ct
- 6433 Lithopolis Rd
- 0 Richardson Rd Unit 226012508
- 340 Madison St
- 175 South St
- 331 Kessler St
- 5634 Shagbark Place
- 556 Tallman St
- 5025 Bixby Rd
- 5203 Blair Ave
- 5424 Bixby Rd
- 4779 Golden Grove Dr
- 4826 Edge Grove Dr
- 3515 Rohr Rd
Ask me questions while you tour the home.