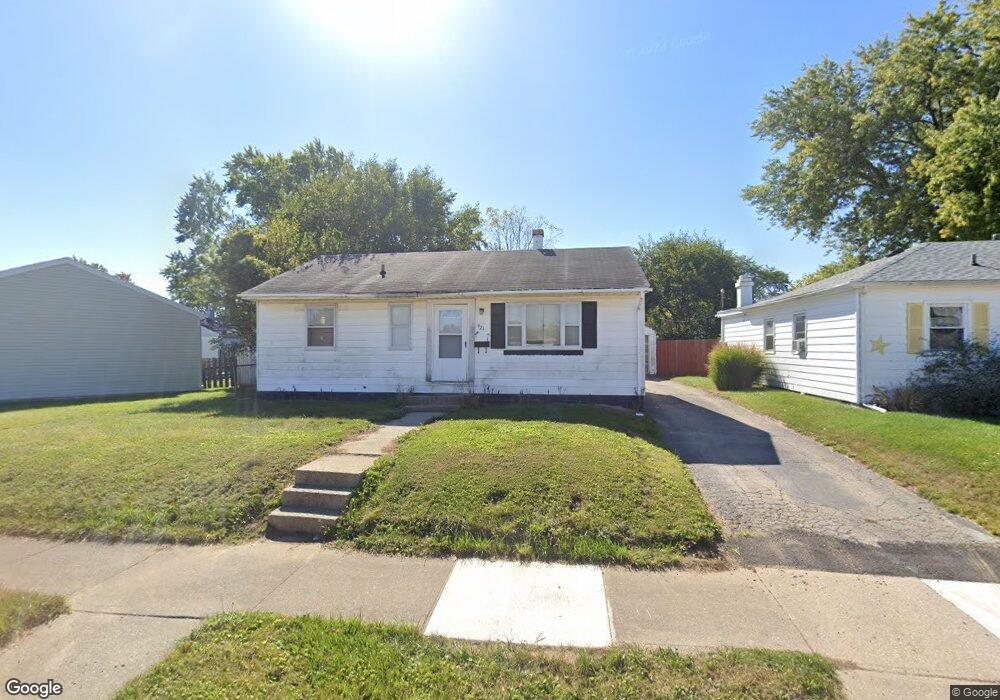
921 Barker Dr Springfield, OH 45505
Estimated Value: $108,675 - $127,000
3
Beds
1
Bath
816
Sq Ft
$147/Sq Ft
Est. Value
About This Home
This home is located at 921 Barker Dr, Springfield, OH 45505 and is currently estimated at $119,669, approximately $146 per square foot. 921 Barker Dr is a home located in Clark County with nearby schools including Mann Elementary School, Schaefer Middle School, and Springfield High School.
Ownership History
Date
Name
Owned For
Owner Type
Purchase Details
Closed on
Aug 30, 2000
Sold by
Leroy Zimmerman Joel and Leroy Marie Lisa
Bought by
Starr Christopher S and Starr Jaimee N
Current Estimated Value
Home Financials for this Owner
Home Financials are based on the most recent Mortgage that was taken out on this home.
Original Mortgage
$59,900
Outstanding Balance
$21,177
Interest Rate
8.26%
Mortgage Type
Purchase Money Mortgage
Estimated Equity
$98,492
Purchase Details
Closed on
Nov 15, 1989
Create a Home Valuation Report for This Property
The Home Valuation Report is an in-depth analysis detailing your home's value as well as a comparison with similar homes in the area
Home Values in the Area
Average Home Value in this Area
Purchase History
| Date | Buyer | Sale Price | Title Company |
|---|---|---|---|
| Starr Christopher S | $59,900 | -- | |
| -- | $39,900 | -- |
Source: Public Records
Mortgage History
| Date | Status | Borrower | Loan Amount |
|---|---|---|---|
| Open | Starr Christopher S | $59,900 |
Source: Public Records
Tax History
| Year | Tax Paid | Tax Assessment Tax Assessment Total Assessment is a certain percentage of the fair market value that is determined by local assessors to be the total taxable value of land and additions on the property. | Land | Improvement |
|---|---|---|---|---|
| 2025 | $1,251 | $27,770 | $4,900 | $22,870 |
| 2024 | $964 | $19,510 | $4,590 | $14,920 |
| 2023 | $964 | $19,510 | $4,590 | $14,920 |
| 2022 | $987 | $19,510 | $4,590 | $14,920 |
| 2021 | $695 | $12,650 | $3,150 | $9,500 |
| 2020 | $697 | $12,650 | $3,150 | $9,500 |
| 2019 | $698 | $12,650 | $3,150 | $9,500 |
| 2018 | $788 | $13,700 | $2,630 | $11,070 |
| 2017 | $787 | $14,088 | $2,625 | $11,463 |
| 2016 | $789 | $14,088 | $2,625 | $11,463 |
| 2015 | $947 | $13,671 | $2,625 | $11,046 |
| 2014 | $943 | $13,671 | $2,625 | $11,046 |
| 2013 | $933 | $13,671 | $2,625 | $11,046 |
Source: Public Records
Map
Nearby Homes
- 1011 Mount Joy St
- 2809 Morton Dr
- 2745 Share St
- 2804 Lowman St
- 2409 Mayfair Dr
- 2338 Dellwood Dr
- 360 Buxton Ave
- 374 Raffensperger Ave
- 631 Kramer Rd
- 3012 E High St
- 273 Raffensperger Ave
- 263 Raffensperger Ave
- 283 Raffensperger Ave
- 306 S Clairmont Ave
- 266 S Clairmont Ave
- 270 S Clairmont Ave
- 302 S Clairmont Ave
- 264 S Clairmont Ave
- 280 S Clairmont Ave
- 138 Lawnview Ave
Your Personal Tour Guide
Ask me questions while you tour the home.