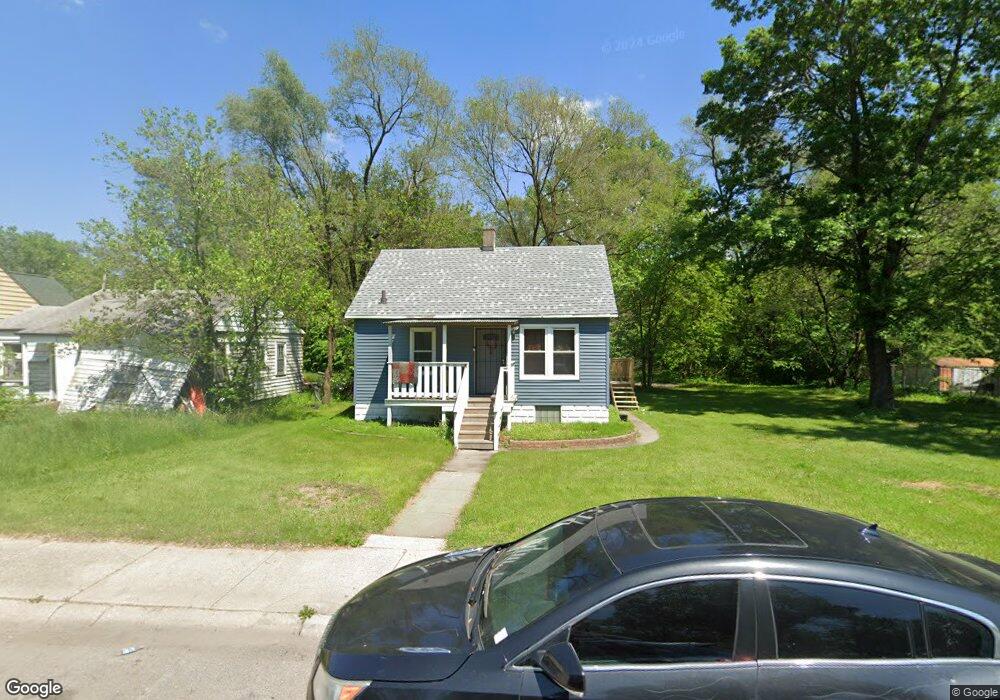
921 Colfax St Gary, IN 46406
Westside NeighborhoodEstimated Value: $68,040 - $237,000
2
Beds
1
Bath
1,430
Sq Ft
$84/Sq Ft
Est. Value
About This Home
This home is located at 921 Colfax St, Gary, IN 46406 and is currently estimated at $120,760, approximately $84 per square foot. 921 Colfax St is a home located in Lake County with nearby schools including Bailly Preparatory Academy, West Side Leadership Academy, and Aspire Charter Academy.
Ownership History
Date
Name
Owned For
Owner Type
Purchase Details
Closed on
Dec 29, 2019
Sold by
Clark James P
Bought by
Diaz Ernesto Martinez
Current Estimated Value
Purchase Details
Closed on
Dec 27, 2019
Sold by
Clark James P
Bought by
Clark Journey
Purchase Details
Closed on
Sep 13, 2019
Sold by
Bates Courtney R and Bates Beverly L
Bought by
Clark James P
Purchase Details
Closed on
Apr 8, 2011
Sold by
Bates Courtney R
Bought by
Bates Courtney R and Bates Beverly L
Create a Home Valuation Report for This Property
The Home Valuation Report is an in-depth analysis detailing your home's value as well as a comparison with similar homes in the area
Home Values in the Area
Average Home Value in this Area
Purchase History
| Date | Buyer | Sale Price | Title Company |
|---|---|---|---|
| Diaz Ernesto Martinez | -- | None Available | |
| Diaz Ernesto Martinez | -- | None Available | |
| Diaz Ernesto Martinez | -- | None Available | |
| Clark Journey | -- | None Available | |
| Clark James P | -- | None Available | |
| Bates Courtney R | -- | None Available |
Source: Public Records
Tax History
| Year | Tax Paid | Tax Assessment Tax Assessment Total Assessment is a certain percentage of the fair market value that is determined by local assessors to be the total taxable value of land and additions on the property. | Land | Improvement |
|---|---|---|---|---|
| 2025 | $582 | $19,000 | $14,300 | $4,700 |
| 2024 | $1,710 | $19,800 | $15,600 | $4,200 |
| 2023 | $361 | $19,400 | $15,600 | $3,800 |
| 2022 | $361 | $14,100 | $10,400 | $3,700 |
| 2021 | $354 | $13,800 | $10,400 | $3,400 |
| 2020 | $679 | $26,500 | $10,400 | $16,100 |
| 2019 | $60 | $26,500 | $10,400 | $16,100 |
| 2018 | $60 | $29,700 | $10,400 | $19,300 |
| 2017 | $60 | $30,000 | $10,400 | $19,600 |
| 2016 | $60 | $34,700 | $10,400 | $24,300 |
| 2014 | -- | $36,200 | $11,800 | $24,400 |
| 2013 | -- | $35,400 | $11,900 | $23,500 |
Source: Public Records
Map
Nearby Homes
Your Personal Tour Guide
Ask me questions while you tour the home.