921 Main St Buchanan, MI 49107
Buchanan AreaEstimated Value: $243,000 - $282,643
About This Home
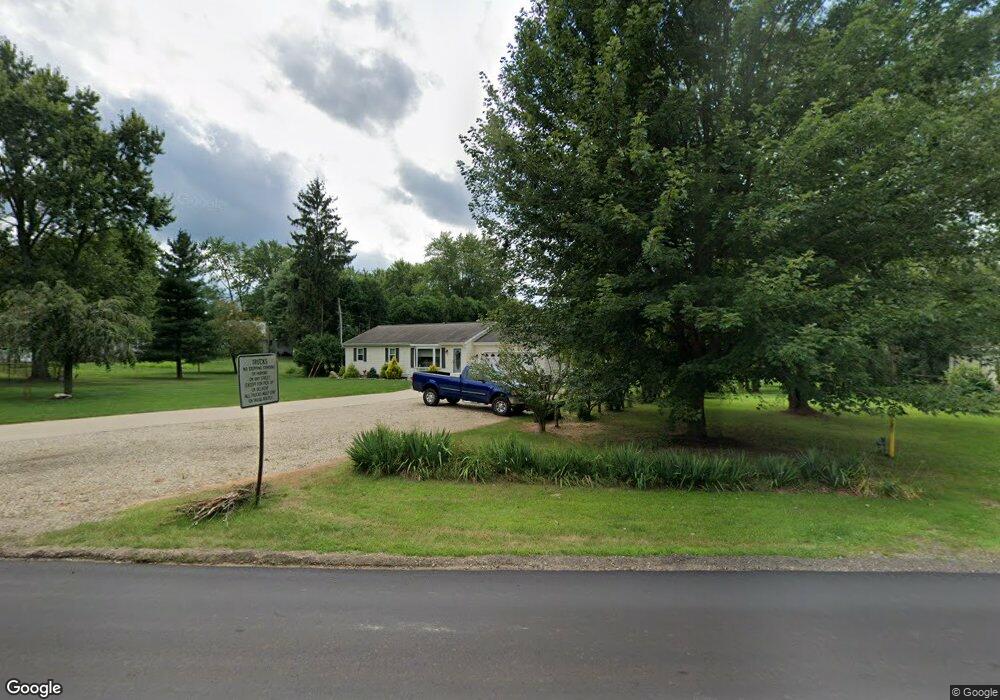
This home is located at 921 Main St, Buchanan, MI 49107 and is currently estimated at $260,411, approximately $246 per square foot. 921 Main St is a home located in Berrien County with nearby schools including Ottawa Elementary School, Moccasin Elementary School, and Buchanan Middle School.
Ownership History
We collect this data history from publicly available records. To have your information removed, we recommend requesting removal directly through your county’s website.
Purchase Details
Purchase Details
Purchase Details
Home Financials for this Owner
Home Financials are based on the most recent Mortgage that was taken out on this home.Purchase Details
Purchase Details
Home Values in the Area
Average Home Value in this Area
Purchase History
We collect this data history from publicly available records. To have your information removed, we recommend requesting removal directly through your county’s website.
| Date | Buyer | Sale Price | Title Company |
|---|---|---|---|
| -- | None Listed On Document | ||
| -- | None Available | ||
| -- | Meridian Title Corporation | ||
| $100 | -- | ||
| $7,000 | -- |
Mortgage History
We collect this data history from publicly available records. To have your information removed, we recommend requesting removal directly through your county’s website.
| Date | Status | Borrower | Loan Amount |
|---|---|---|---|
| Previous Owner | $60,800 |
Tax History
We collect this data history from publicly available records. To have your information removed, we recommend requesting removal directly through your county’s website.
| Year | Tax Paid | Tax Assessment Tax Assessment Total Assessment is a certain percentage of the fair market value that is determined by local assessors to be the total taxable value of land and additions on the property. | Land | Improvement |
|---|---|---|---|---|
| 2026 | $2,970 | $169,200 | $0 | $0 |
| 2025 | $2,905 | $131,900 | $0 | $0 |
| 2024 | $2,701 | $135,000 | $0 | $0 |
| 2023 | $2,606 | $121,900 | $0 | $0 |
| 2022 | $2,556 | $115,700 | $0 | $0 |
| 2021 | $2,673 | $107,300 | $3,600 | $103,700 |
| 2020 | $2,638 | $106,700 | $0 | $0 |
| 2019 | $2,045 | $82,300 | $3,600 | $78,700 |
| 2018 | $2,017 | $82,300 | $0 | $0 |
| 2017 | $1,976 | $83,800 | $0 | $0 |
| 2016 | $1,962 | $76,300 | $0 | $0 |
| 2015 | $1,958 | $72,300 | $0 | $0 |
| 2014 | $1,773 | $72,100 | $0 | $0 |
Map
- 406 Elizabeth St
- 313 Elizabeth St
- 113 W 5th St
- 208 Moccasin St
- 110 Theoda Ct
- 14931 Bachelor Island
- 312 W Chicago St
- 210 Days Ave
- 710 S Oak St
- 3297 W Front St
- 14823 N Main St
- 103 W Smith St
- 502 Clark St
- 401 Berrien St
- 1005 E Front St
- 1025 E Front St
- Lot B Broceus School Rd
- Lot A Broceus School Rd
- Lot C Broceus School Rd
- 1400 Block Broceus School Rd
Ask me questions while you tour the home.