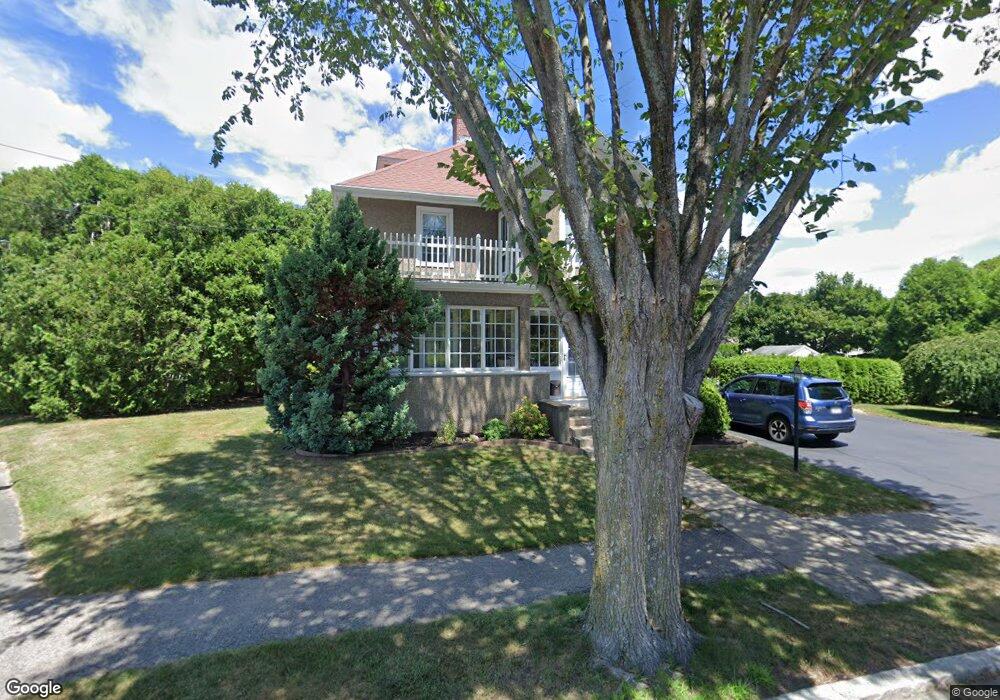
93 Balch St Beverly, MA 01915
North Beverly NeighborhoodEstimated Value: $860,000 - $930,000
About This Home
This home is located at 93 Balch St, Beverly, MA 01915 and is currently estimated at $891,508, approximately $353 per square foot. 93 Balch St is a home located in Essex County with nearby schools including Beverly High School, The Saints Academy, and Shore Country Day School.
Ownership History
We collect this data history from publicly available records. To have your information removed, we recommend requesting removal directly through your county’s website.
Purchase Details
Purchase Details
Home Values in the Area
Average Home Value in this Area
Purchase History
We collect this data history from publicly available records. To have your information removed, we recommend requesting removal directly through your county’s website.
| Date | Buyer | Sale Price | Title Company |
|---|---|---|---|
| -- | -- | ||
| $32,000 | -- |
Mortgage History
We collect this data history from publicly available records. To have your information removed, we recommend requesting removal directly through your county’s website.
| Date | Status | Borrower | Loan Amount |
|---|---|---|---|
| Previous Owner | $200,000 | ||
| Previous Owner | $100,000 | ||
| Previous Owner | $50,000 | ||
| Previous Owner | $100,000 | ||
| Previous Owner | $25,000 | ||
| Previous Owner | $86,000 | ||
| Previous Owner | $90,000 |
Tax History
We collect this data history from publicly available records. To have your information removed, we recommend requesting removal directly through your county’s website.
| Year | Tax Paid | Tax Assessment Tax Assessment Total Assessment is a certain percentage of the fair market value that is determined by local assessors to be the total taxable value of land and additions on the property. | Land | Improvement |
|---|---|---|---|---|
| 2025 | $7,552 | $687,200 | $385,300 | $301,900 |
| 2024 | $7,279 | $648,200 | $345,700 | $302,500 |
| 2023 | $6,833 | $606,800 | $304,300 | $302,500 |
| 2022 | $6,927 | $569,200 | $266,700 | $302,500 |
| 2021 | $6,441 | $507,200 | $235,100 | $272,100 |
| 2020 | $6,305 | $491,400 | $219,300 | $272,100 |
| 2019 | $6,144 | $465,100 | $201,500 | $263,600 |
| 2018 | $5,766 | $424,000 | $183,700 | $240,300 |
| 2017 | $5,689 | $398,400 | $158,100 | $240,300 |
| 2016 | $5,448 | $378,600 | $138,300 | $240,300 |
| 2015 | $5,342 | $378,600 | $138,300 | $240,300 |
Map
- 50 Balch St Unit 111
- 50 Balch St Unit 115
- 50 Balch St Unit 310
- 50 Balch St Unit 311
- 50 Balch St Unit 207
- 50 Balch St Unit 410
- 50 Balch St Unit 505
- 50 Balch St Unit 405
- 50 Balch St Unit 203
- 50 Balch St Unit 509
- 50 Balch St Unit 309
- 50 Balch St Unit 303
- 50 Balch St Unit 108
- 50 Balch St Unit 105
- 159 Mckay St
- 9 Auburn Rd
- 526 Cabot St
- 492 Cabot St Unit 1A
- 501 Cabot St Unit 2
- 15 Conway St
- 5 Bosworth St
- 6 New Balch St
- 8 New Balch St
- 95 Balch St
- 69 Balch St
- 12 New Balch St
- 14 New Balch St
- 7 Bosworth St
- 99 Balch St
- 6 Bosworth St
- 16 New Balch St
- 131 Mckay St Unit 4
- 131 Mckay St Unit 2
- 131 Mckay St Unit 203
- 131 Mckay St Unit 123
- 131 Mckay St Unit 130
- 131 Mckay St Unit 132
- 131 Mckay St Unit A104
- 131 Mckay St Unit A102
- 131 Mckay St Unit A103
Ask me questions while you tour the home.