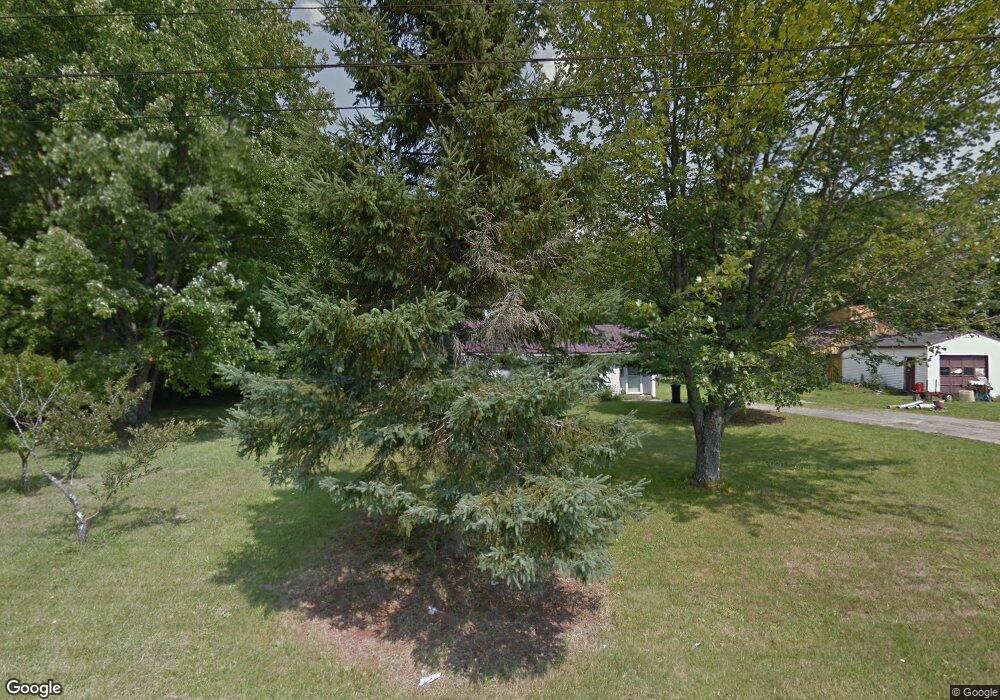
93 Berry Rd Saco, ME 04072
North Saco NeighborhoodEstimated Value: $422,000 - $559,000
2
Beds
1
Bath
1,551
Sq Ft
$310/Sq Ft
Est. Value
About This Home
This home is located at 93 Berry Rd, Saco, ME 04072 and is currently estimated at $481,240, approximately $310 per square foot. 93 Berry Rd is a home located in York County with nearby schools including C K Burns School, Saco Middle School, and Saint James School.
Ownership History
Date
Name
Owned For
Owner Type
Purchase Details
Closed on
Mar 13, 2026
Sold by
Belanger Ft and Belanger
Bought by
Belanger Ronald
Current Estimated Value
Purchase Details
Closed on
Jun 25, 2020
Sold by
Belanger Ronald
Bought by
Belanger Ronald and Belanger Wanda A
Home Financials for this Owner
Home Financials are based on the most recent Mortgage that was taken out on this home.
Original Mortgage
$120,000
Interest Rate
3.2%
Mortgage Type
New Conventional
Create a Home Valuation Report for This Property
The Home Valuation Report is an in-depth analysis detailing your home's value as well as a comparison with similar homes in the area
Home Values in the Area
Average Home Value in this Area
Purchase History
| Date | Buyer | Sale Price | Title Company |
|---|---|---|---|
| Belanger Ronald L | -- | None Available | |
| Belanger Ronald L | -- | None Available | |
| Belanger Ronald L | -- | None Available |
Source: Public Records
Mortgage History
| Date | Status | Borrower | Loan Amount |
|---|---|---|---|
| Open | Belanger Ronald L | $120,000 | |
| Closed | Belanger Ronald L | $120,000 |
Source: Public Records
Tax History
| Year | Tax Paid | Tax Assessment Tax Assessment Total Assessment is a certain percentage of the fair market value that is determined by local assessors to be the total taxable value of land and additions on the property. | Land | Improvement |
|---|---|---|---|---|
| 2024 | $4,691 | $333,900 | $147,100 | $186,800 |
| 2023 | $4,925 | $333,900 | $147,100 | $186,800 |
| 2022 | $4,487 | $244,800 | $111,900 | $132,900 |
| 2021 | $4,307 | $228,100 | $100,600 | $127,500 |
| 2020 | $3,428 | $174,300 | $88,700 | $85,600 |
| 2019 | $3,378 | $174,300 | $88,700 | $85,600 |
| 2018 | $3,221 | $166,200 | $80,600 | $85,600 |
| 2017 | $3,068 | $158,300 | $73,600 | $84,700 |
| 2016 | $2,779 | $143,100 | $57,300 | $85,800 |
| 2015 | $2,731 | $142,100 | $57,300 | $84,800 |
| 2014 | $2,646 | $142,100 | $57,300 | $84,800 |
| 2013 | $2,640 | $142,100 | $57,300 | $84,800 |
Source: Public Records
Map
Nearby Homes
- 00 Cottonwood Dr
- 43 New County Rd
- 5 Apostolic Way
- 2 Deer Run Dr
- 73 Hillview Ave
- 1 Baxter Blvd
- 24 Remi Dr
- 2 Baxter Blvd
- 4 Baxter Blvd
- 7 Hubbard St
- TBD Oakland St
- 15 Wendy Way
- 18A Garfield St
- 18 Buxton Rd
- 13 Western Ave
- 17 Buzzell Rd
- 242 Lincoln St
- 22 Tasker St Unit 11
- 22 Tasker St Unit 10
- 91 Western Ave Unit 3
Your Personal Tour Guide
Ask me questions while you tour the home.