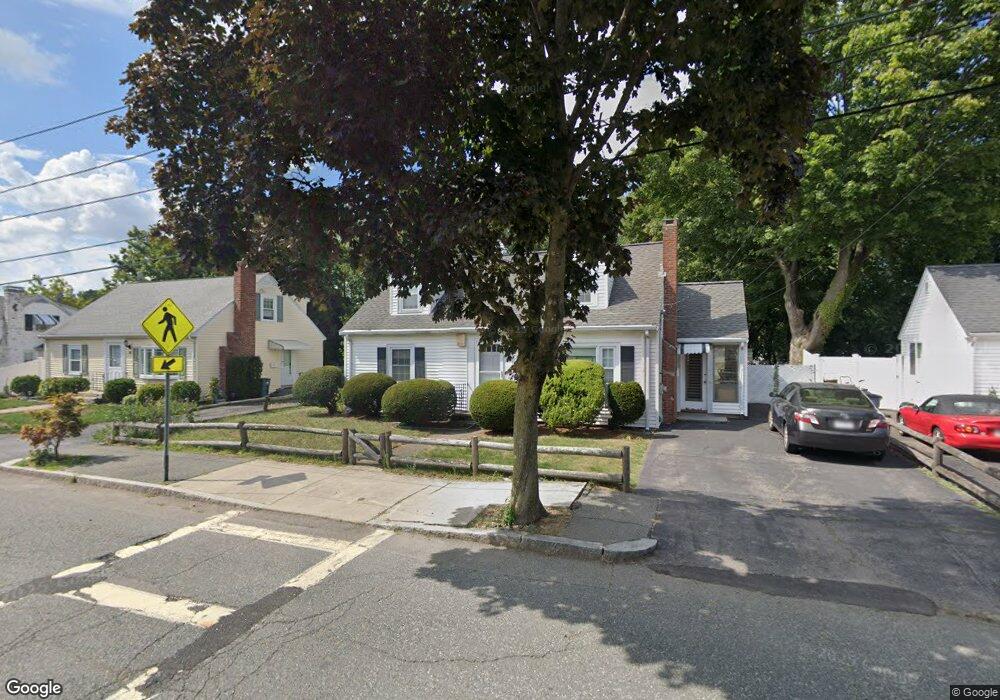
93 Brooks Ave Quincy, MA 02169
South Quincy NeighborhoodEstimated Value: $560,000 - $706,000
4
Beds
3
Baths
1,224
Sq Ft
$528/Sq Ft
Est. Value
About This Home
This home is located at 93 Brooks Ave, Quincy, MA 02169 and is currently estimated at $645,687, approximately $527 per square foot. 93 Brooks Ave is a home located in Norfolk County with nearby schools including South West Middle School, Lincoln-Hancock Community School, and Quincy High School.
Ownership History
Date
Name
Owned For
Owner Type
Purchase Details
Closed on
Apr 19, 2011
Sold by
Zhang Fu Q and Zhang Pui Y
Bought by
Zhang Kevin
Current Estimated Value
Purchase Details
Closed on
Jun 28, 1995
Sold by
Ferrazzi Mary J and Ferrazzi William M
Bought by
Zhang Fu Q and Zhang Pui Y
Home Financials for this Owner
Home Financials are based on the most recent Mortgage that was taken out on this home.
Original Mortgage
$70,000
Interest Rate
7.8%
Mortgage Type
Purchase Money Mortgage
Create a Home Valuation Report for This Property
The Home Valuation Report is an in-depth analysis detailing your home's value as well as a comparison with similar homes in the area
Home Values in the Area
Average Home Value in this Area
Purchase History
| Date | Buyer | Sale Price | Title Company |
|---|---|---|---|
| Zhang Kevin | -- | -- | |
| Zhang Fu Q | $136,000 | -- |
Source: Public Records
Mortgage History
| Date | Status | Borrower | Loan Amount |
|---|---|---|---|
| Previous Owner | Zhang Fu Q | $70,000 |
Source: Public Records
Tax History
| Year | Tax Paid | Tax Assessment Tax Assessment Total Assessment is a certain percentage of the fair market value that is determined by local assessors to be the total taxable value of land and additions on the property. | Land | Improvement |
|---|---|---|---|---|
| 2025 | $6,876 | $596,400 | $320,200 | $276,200 |
| 2024 | $6,529 | $579,300 | $305,400 | $273,900 |
| 2023 | $5,952 | $534,800 | $278,600 | $256,200 |
| 2022 | $5,746 | $479,600 | $233,800 | $245,800 |
| 2021 | $5,614 | $462,400 | $233,800 | $228,600 |
| 2020 | $5,734 | $461,300 | $233,800 | $227,500 |
| 2019 | $5,299 | $422,200 | $221,200 | $201,000 |
| 2018 | $5,188 | $388,900 | $205,600 | $183,300 |
| 2017 | $4,992 | $352,300 | $196,200 | $156,100 |
| 2016 | $4,575 | $318,600 | $172,000 | $146,600 |
| 2015 | $4,563 | $312,500 | $172,000 | $140,500 |
| 2014 | $4,339 | $292,000 | $172,000 | $120,000 |
Source: Public Records
Map
Nearby Homes
- 79 Gilbert St
- 51 Branch St Unit 3
- 21 Totman St Unit 205
- 21 Totman St Unit 409
- 21 Totman St Unit 203
- 21 Totman St Unit 403
- 21 Totman St Unit 301
- 21 Totman St Unit 208
- 21 Totman St Unit PH-401
- 21 Totman St Unit 204
- 87 Village Dr
- 132 Centre St
- 56 Penn St Unit 4
- 91 Garfield St
- 21 Arthur St
- 8 Jackson St Unit B1
- 8 Jackson St Unit B4
- 9 Westford St
- 99 Verchild St
- 52 Packards Ln Unit 4
- 89 Brooks Ave
- 99 Brooks Ave
- 83 Brooks Ave
- 103 Brooks Ave
- 79 Brooks Ave
- 109 Brooks Ave
- 97 Intervale St
- 99 Intervale St Unit 99
- 75 Brooks Ave
- 113 Brooks Ave
- 101 Intervale St
- 62 Nightingale Ave
- 56 Nightingale Ave
- 102 Roberts St
- 96 Roberts St
- 24 Caledonia Ave
- 106 Roberts St
- 44 Nightingale Ave
- 69 Brooks Ave
- 66 Nightingale Ave
Your Personal Tour Guide
Ask me questions while you tour the home.