93 Meeson St Fall River, MA 02724
Maplewood NeighborhoodEstimated Value: $480,226 - $761,000
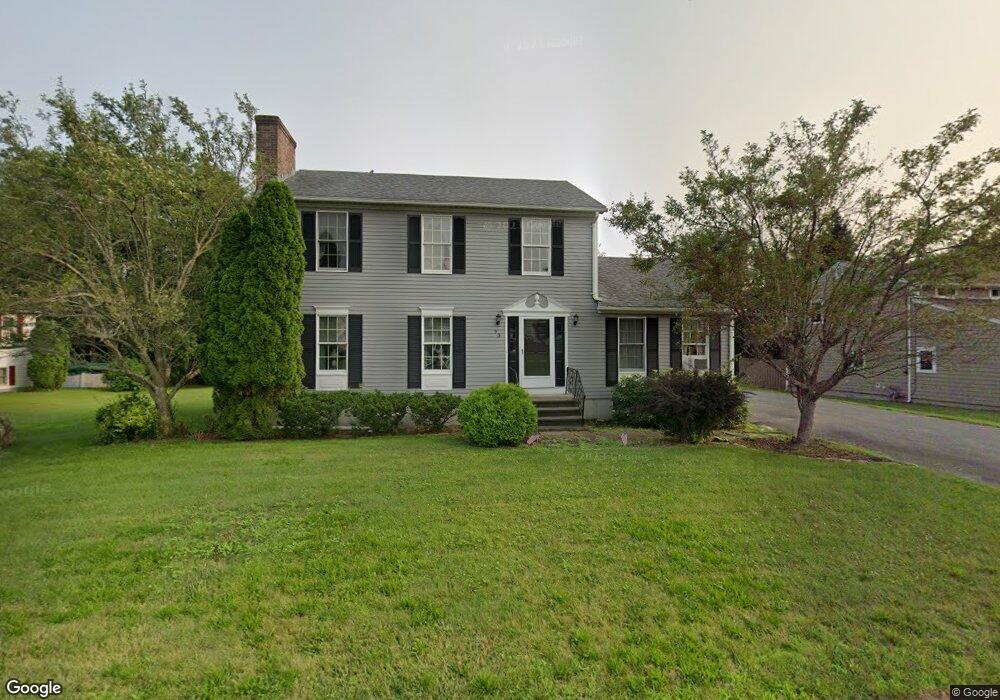
About This Home
This home is located at 93 Meeson St, Fall River, MA 02724 and is currently estimated at $575,557, approximately $288 per square foot. 93 Meeson St is a home located in Bristol County with nearby schools including Henry Lord Community School, B M C Durfee High School, and Argosy Collegiate Charter School.
Ownership History
We collect this data history from publicly available records. To have your information removed, we recommend requesting removal directly through your county’s website.
Purchase Details
Home Financials for this Owner
Home Financials are based on the most recent Mortgage that was taken out on this home.Home Values in the Area
Average Home Value in this Area
Purchase History
We collect this data history from publicly available records. To have your information removed, we recommend requesting removal directly through your county’s website.
| Date | Buyer | Sale Price | Title Company |
|---|---|---|---|
| $160,000 | -- |
Mortgage History
We collect this data history from publicly available records. To have your information removed, we recommend requesting removal directly through your county’s website.
| Date | Status | Borrower | Loan Amount |
|---|---|---|---|
| Closed | $40,000 |
Tax History
We collect this data history from publicly available records. To have your information removed, we recommend requesting removal directly through your county’s website.
| Year | Tax Paid | Tax Assessment Tax Assessment Total Assessment is a certain percentage of the fair market value that is determined by local assessors to be the total taxable value of land and additions on the property. | Land | Improvement |
|---|---|---|---|---|
| 2025 | $4,569 | $399,000 | $134,300 | $264,700 |
| 2024 | $4,271 | $371,700 | $129,200 | $242,500 |
| 2023 | $4,391 | $357,900 | $110,800 | $247,100 |
| 2022 | $3,858 | $305,700 | $100,700 | $205,000 |
| 2021 | $3,740 | $270,400 | $93,200 | $177,200 |
| 2020 | $3,683 | $254,900 | $89,200 | $165,700 |
| 2019 | $3,552 | $243,600 | $84,900 | $158,700 |
| 2018 | $3,509 | $240,000 | $83,300 | $156,700 |
| 2017 | $3,345 | $238,900 | $85,000 | $153,900 |
| 2016 | $3,177 | $233,100 | $88,600 | $144,500 |
| 2015 | $3,059 | $233,900 | $85,300 | $148,600 |
| 2014 | $2,999 | $238,400 | $89,800 | $148,600 |
Map
- 43 Tucker St
- 96 Star St
- 478 Tucker St
- 1153 1157 Slade
- 321 Embert St
- 150 Crawford St
- 649 Stafford Rd
- 1084 Laurel St
- 1852 S Main St
- 240 Montaup St
- 1264 Plymouth Ave
- 477 Palmer St
- 25 Palmer St
- 29 Palmer St
- 1967 Rodman St
- 1142-1144 Plymouth Ave
- 1138 Plymouth Ave
- 217 Brayton Ave
- 525 Anthony St
- 27 Cook St
Ask me questions while you tour the home.