93 Pinckney St Dracut, MA 01826
Dracut AreaEstimated Value: $406,000 - $457,888
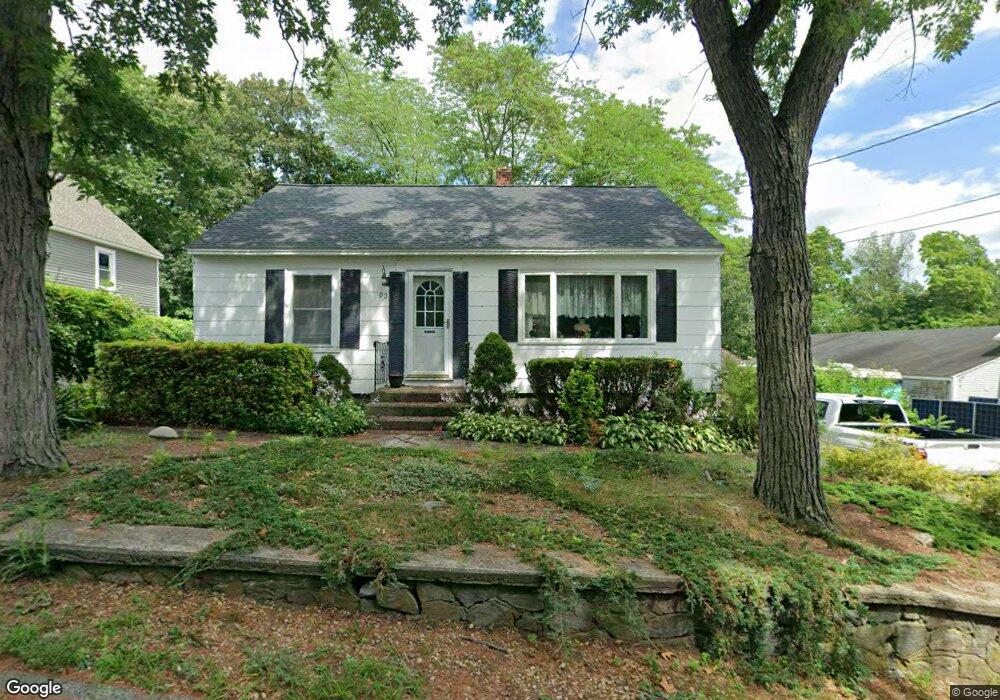
About This Home
This home is located at 93 Pinckney St, Dracut, MA 01826 and is currently estimated at $440,472, approximately $392 per square foot. 93 Pinckney St is a home located in Middlesex County with nearby schools including Joseph A. Campbell Elementary School, Richardson Middle School, and Dracut Senior High School.
Ownership History
We collect this data history from publicly available records. To have your information removed, we recommend requesting removal directly through your county’s website.
Purchase Details
Purchase Details
Home Values in the Area
Average Home Value in this Area
Purchase History
We collect this data history from publicly available records. To have your information removed, we recommend requesting removal directly through your county’s website.
| Date | Buyer | Sale Price | Title Company |
|---|---|---|---|
| -- | None Available | ||
| -- | -- |
Mortgage History
We collect this data history from publicly available records. To have your information removed, we recommend requesting removal directly through your county’s website.
| Date | Status | Borrower | Loan Amount |
|---|---|---|---|
| Previous Owner | $19,000 |
Tax History
We collect this data history from publicly available records. To have your information removed, we recommend requesting removal directly through your county’s website.
| Year | Tax Paid | Tax Assessment Tax Assessment Total Assessment is a certain percentage of the fair market value that is determined by local assessors to be the total taxable value of land and additions on the property. | Land | Improvement |
|---|---|---|---|---|
| 2025 | $3,927 | $388,000 | $188,400 | $199,600 |
| 2024 | $3,796 | $363,300 | $179,400 | $183,900 |
| 2023 | $3,660 | $316,100 | $156,000 | $160,100 |
| 2022 | $3,541 | $288,100 | $141,800 | $146,300 |
| 2021 | $12,404 | $273,800 | $128,900 | $144,900 |
| 2020 | $3,460 | $259,200 | $125,200 | $134,000 |
| 2019 | $10,961 | $253,200 | $119,200 | $134,000 |
| 2018 | $3,997 | $227,800 | $119,200 | $108,600 |
| 2017 | $3,067 | $227,800 | $119,200 | $108,600 |
| 2016 | $2,977 | $200,600 | $114,600 | $86,000 |
| 2015 | $2,928 | $196,100 | $114,600 | $81,500 |
| 2014 | $2,788 | $192,400 | $114,600 | $77,800 |
Map
- 117 Bellevue Ave
- 48 Grant St
- 10 Grant St
- 55 Grant St
- 80 Brigham Ave
- 215 Lexington Rd
- 821 Merrimack Ave
- 160 Burnham Rd
- 24 Novak Cir
- 20 Farm Pond Rd
- 225 River Rd
- 10 Haverhill St
- 71 Brook St
- 772 Trull Rd
- 187 Havilah St
- 105 Stafford Rd
- 1 Francis Dr Unit 405
- 2 Francis Dr Unit 405
- 2 Francis Dr Unit 203
- 2 Francis Dr Unit 301
- 97 Pinckney St
- 85 Pinckney St
- 96 Pinckney St
- 98 Pinckney St
- 84 Pinckney St Unit 84
- 86 Pinckney St
- 115 Pinckney St
- 115 Pinckney St
- 91 Percy St
- 70 Morris St
- 935 Methuen St Unit 16
- 935 Methuen St Unit 15
- 935 Methuen St Unit 14
- 935 Methuen St Unit 13
- 935 Methuen St Unit 12
- 935 Methuen St Unit 11
- 935 Methuen St Unit 10
- 935 Methuen St Unit 9
- 72 Morris St
- 97 Percy St
Ask me questions while you tour the home.