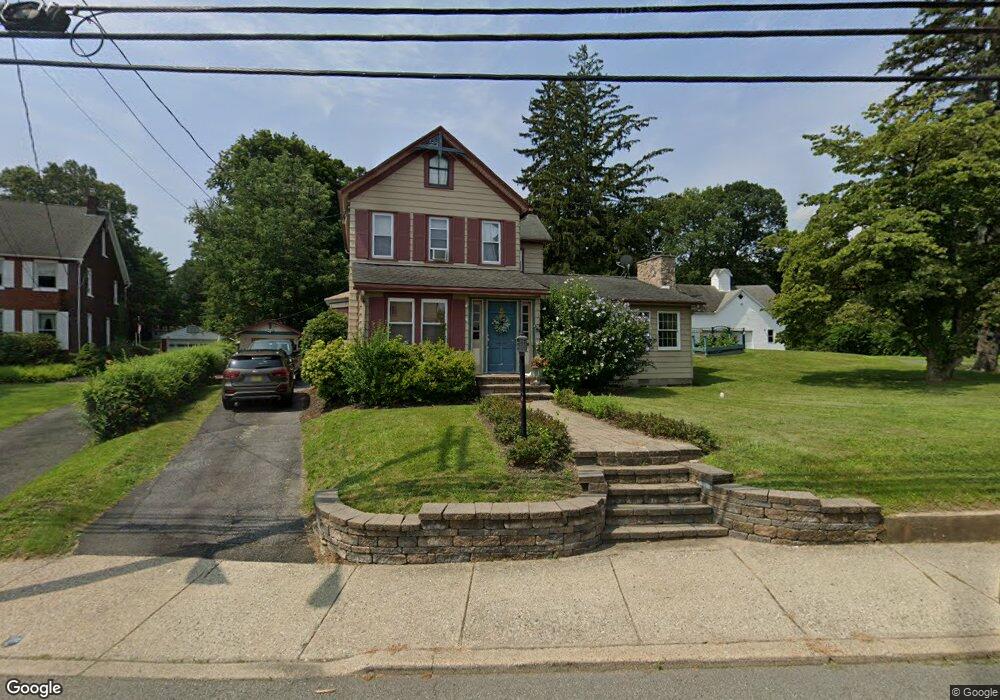
93 S Main St Wharton, NJ 07885
Estimated Value: $450,278 - $528,000
Studio
--
Bath
1,613
Sq Ft
$295/Sq Ft
Est. Value
About This Home
This home is located at 93 S Main St, Wharton, NJ 07885 and is currently estimated at $475,820, approximately $294 per square foot. 93 S Main St is a home located in Morris County with nearby schools including Marie V. Duffy Elementary School and A C Mac Kinnon Middle School.
Ownership History
Date
Name
Owned For
Owner Type
Purchase Details
Closed on
Aug 7, 2001
Sold by
Shuback Harry
Bought by
Chiappa Barbara
Current Estimated Value
Home Financials for this Owner
Home Financials are based on the most recent Mortgage that was taken out on this home.
Original Mortgage
$43,900
Outstanding Balance
$16,914
Interest Rate
6.98%
Estimated Equity
$458,906
Purchase Details
Closed on
Jul 1, 1998
Sold by
Estate Of Clara A Shuback and Shuback Harry A
Bought by
Shuback Harry A
Create a Home Valuation Report for This Property
The Home Valuation Report is an in-depth analysis detailing your home's value as well as a comparison with similar homes in the area
Home Values in the Area
Average Home Value in this Area
Purchase History
We collect this data history from publicly available records. To have your information removed, we recommend requesting removal directly through your county’s website.
| Date | Buyer | Sale Price | Title Company |
|---|---|---|---|
| Chiappa Barbara | $179,900 | -- | |
| Shuback Harry A | -- | -- |
Source: Public Records
Mortgage History
We collect this data history from publicly available records. To have your information removed, we recommend requesting removal directly through your county’s website.
| Date | Status | Borrower | Loan Amount |
|---|---|---|---|
| Open | Chiappa Barbara | $43,900 |
Source: Public Records
Tax History
| Year | Tax Paid | Tax Assessment Tax Assessment Total Assessment is a certain percentage of the fair market value that is determined by local assessors to be the total taxable value of land and additions on the property. | Land | Improvement |
|---|---|---|---|---|
| 2025 | $9,924 | $359,900 | $111,100 | $248,800 |
| 2024 | $9,344 | $335,400 | $106,600 | $228,800 |
| 2023 | $9,344 | $312,100 | $102,100 | $210,000 |
| 2022 | $8,647 | $295,900 | $102,100 | $193,800 |
| 2021 | $8,647 | $283,400 | $102,100 | $181,300 |
| 2020 | $8,397 | $270,100 | $97,600 | $172,500 |
| 2019 | $8,062 | $261,400 | $97,600 | $163,800 |
| 2018 | $7,537 | $249,400 | $93,100 | $156,300 |
| 2017 | $7,366 | $241,100 | $88,600 | $152,500 |
| 2016 | $6,864 | $241,100 | $88,600 | $152,500 |
| 2015 | $7,215 | $238,600 | $88,600 | $150,000 |
| 2014 | $7,098 | $232,200 | $88,600 | $143,600 |
Source: Public Records
Map
Nearby Homes
Your Personal Tour Guide
Ask me questions while you tour the home.