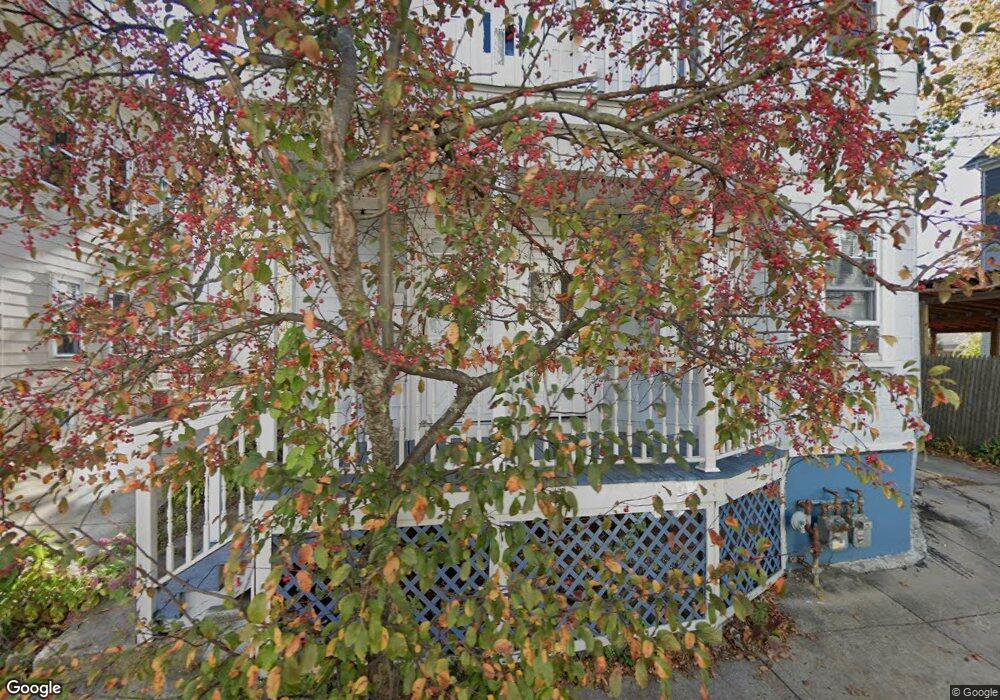
93 Vandewater St Providence, RI 02908
Wanskuck NeighborhoodEstimated Value: $460,000 - $606,000
4
Beds
2
Baths
2,146
Sq Ft
$243/Sq Ft
Est. Value
About This Home
This home is located at 93 Vandewater St, Providence, RI 02908 and is currently estimated at $521,158, approximately $242 per square foot. 93 Vandewater St is a home located in Providence County with nearby schools including St. Pius V Catholic School and The San Miguel School.
Ownership History
Date
Name
Owned For
Owner Type
Purchase Details
Closed on
Sep 2, 2003
Sold by
Sullivan George T and Sullivan Holly A
Bought by
Lugo Santo I
Current Estimated Value
Home Financials for this Owner
Home Financials are based on the most recent Mortgage that was taken out on this home.
Original Mortgage
$180,500
Interest Rate
5.69%
Mortgage Type
Purchase Money Mortgage
Create a Home Valuation Report for This Property
The Home Valuation Report is an in-depth analysis detailing your home's value as well as a comparison with similar homes in the area
Home Values in the Area
Average Home Value in this Area
Purchase History
| Date | Buyer | Sale Price | Title Company |
|---|---|---|---|
| Lugo Santo I | $190,000 | -- |
Source: Public Records
Mortgage History
| Date | Status | Borrower | Loan Amount |
|---|---|---|---|
| Open | Lugo Santo I | $156,000 | |
| Closed | Lugo Santo I | $10,714 | |
| Closed | Lugo Santo I | $25,000 | |
| Closed | Lugo Santo I | $180,500 |
Source: Public Records
Tax History
| Year | Tax Paid | Tax Assessment Tax Assessment Total Assessment is a certain percentage of the fair market value that is determined by local assessors to be the total taxable value of land and additions on the property. | Land | Improvement |
|---|---|---|---|---|
| 2025 | $3,240 | $429,200 | $126,700 | $302,500 |
| 2024 | $5,107 | $278,300 | $71,300 | $207,000 |
| 2023 | $5,107 | $278,300 | $71,300 | $207,000 |
| 2022 | $4,954 | $278,300 | $71,300 | $207,000 |
| 2021 | $4,271 | $173,900 | $39,200 | $134,700 |
| 2020 | $4,271 | $173,900 | $39,200 | $134,700 |
| 2019 | $4,271 | $173,900 | $39,200 | $134,700 |
| 2018 | $4,069 | $127,300 | $38,400 | $88,900 |
| 2017 | $4,069 | $127,300 | $38,400 | $88,900 |
| 2016 | $4,069 | $127,300 | $38,400 | $88,900 |
| 2015 | $3,469 | $104,800 | $43,900 | $60,900 |
| 2014 | $3,537 | $104,800 | $43,900 | $60,900 |
| 2013 | $3,537 | $104,800 | $43,900 | $60,900 |
Source: Public Records
Map
Nearby Homes
- 99 Vandewater St
- 87 Vandewater St
- 101 Vandewater St
- 101 Vandewater St Unit 3
- 110 Sherwood St
- 98 Sherwood St
- 103 Vandewater St Unit 2
- 96 Vandewater St
- 98 Vandewater St
- 100 Vandewater St
- 100 Vandewater St
- 100 Vandewater St Unit 2
- 100 Vandewater St Unit 3
- 100 Vandewater St Unit 1
- 86 Vandewater St
- 116 Sherwood St Unit 1
- 104 Vandewater St
- 106 Vandewater St Unit 3FL
- 120 Sherwood St
- 81 Vandewater St
Your Personal Tour Guide
Ask me questions while you tour the home.