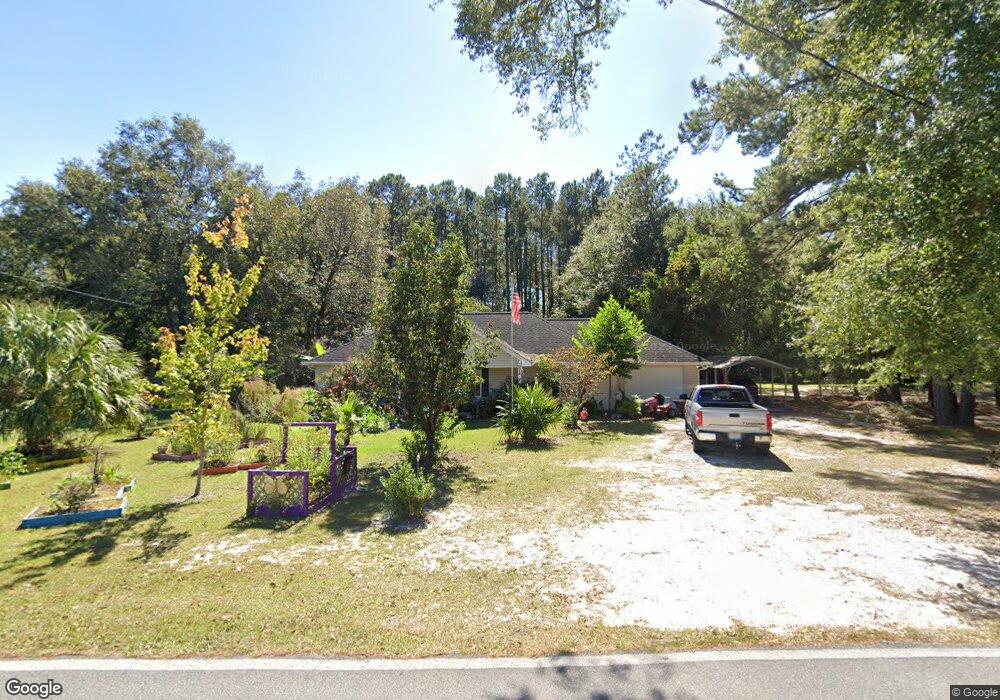
930 E Blackshear Ave Waycross, GA 31501
Estimated Value: $186,000 - $199,000
3
Beds
2
Baths
1,400
Sq Ft
$137/Sq Ft
Est. Value
About This Home
This home is located at 930 E Blackshear Ave, Waycross, GA 31501 and is currently estimated at $192,432, approximately $137 per square foot. 930 E Blackshear Ave is a home located in Ware County with nearby schools including Center Elementary School, Waycross Middle School, and Ware County High School.
Ownership History
Date
Name
Owned For
Owner Type
Purchase Details
Closed on
Apr 7, 2008
Sold by
Tison & Mulkey Llc
Bought by
Vandruff Carl F and Vandruff Norma Q
Current Estimated Value
Home Financials for this Owner
Home Financials are based on the most recent Mortgage that was taken out on this home.
Original Mortgage
$50,000
Outstanding Balance
$31,347
Interest Rate
6.03%
Mortgage Type
New Conventional
Estimated Equity
$161,085
Purchase Details
Closed on
Mar 30, 2008
Sold by
Tison & Mulkey Llc
Bought by
Baker Gilbert Nathan and Baker Lora Sabrina
Home Financials for this Owner
Home Financials are based on the most recent Mortgage that was taken out on this home.
Original Mortgage
$50,000
Outstanding Balance
$31,347
Interest Rate
6.03%
Mortgage Type
New Conventional
Estimated Equity
$161,085
Purchase Details
Closed on
Mar 8, 2007
Sold by
Tison G Bruce
Bought by
Tison & Mulkey Llc
Purchase Details
Closed on
Sep 14, 2006
Sold by
Taylor Donna A
Bought by
Mulkey Robert Chad and Bruce Tison G
Purchase Details
Closed on
Feb 28, 1995
Sold by
Arnold Jack E
Bought by
Taylor Donna A
Create a Home Valuation Report for This Property
The Home Valuation Report is an in-depth analysis detailing your home's value as well as a comparison with similar homes in the area
Purchase History
| Date | Buyer | Sale Price | Title Company |
|---|---|---|---|
| Vandruff Carl F | $105,900 | -- | |
| Baker Gilbert Nathan | -- | -- | |
| Tison & Mulkey Llc | -- | -- | |
| Mulkey Robert Chad | $45,000 | -- | |
| Taylor Donna A | -- | -- |
Source: Public Records
Mortgage History
| Date | Status | Borrower | Loan Amount |
|---|---|---|---|
| Open | Vandruff Carl F | $50,000 |
Source: Public Records
Tax History
| Year | Tax Paid | Tax Assessment Tax Assessment Total Assessment is a certain percentage of the fair market value that is determined by local assessors to be the total taxable value of land and additions on the property. | Land | Improvement |
|---|---|---|---|---|
| 2025 | -- | $91,163 | $3,960 | $87,203 |
| 2024 | -- | $77,564 | $3,960 | $73,604 |
| 2023 | $1,975 | $68,415 | $1,675 | $66,740 |
| 2022 | $1,975 | $68,415 | $1,675 | $66,740 |
| 2021 | $1,892 | $60,320 | $1,675 | $58,645 |
| 2020 | $1,265 | $39,909 | $1,675 | $38,234 |
| 2019 | $1,114 | $34,465 | $1,675 | $32,790 |
| 2018 | $1,075 | $32,952 | $1,675 | $31,277 |
| 2017 | $1,074 | $32,952 | $1,675 | $31,277 |
| 2016 | $1,074 | $32,952 | $1,675 | $31,277 |
| 2015 | $1,084 | $32,952 | $1,675 | $31,277 |
| 2014 | $1,083 | $32,952 | $1,675 | $31,277 |
| 2013 | -- | $32,952 | $1,675 | $31,277 |
Source: Public Records
Map
Nearby Homes
- 904 Golfview Dr
- 606 Poplar St
- 2312 Spurgeon St
- 2109 Neal St
- 607 Linden Dr
- 901 E Waring St
- 2120 Tebeau St
- 2218 Riverside Ave
- 2202 Pioneer St
- 601 Community Dr
- 1301 Riverside Ave
- 0 Beville St
- 222 Linden Dr
- 404 Community Dr
- 702 E Waring St
- .22 Alice St
- 406 Preston St
- 1509 Bethune St
- 2784 Autumn Ridge Ln
- 402 Preston St
- 1000 E Blackshear Ave
- 908 E Blackshear Ave
- 1030 E Blackshear Ave
- 911 E Blackshear Ave
- 906 E Blackshear Ave
- 2006 Neal St
- 909 E Blackshear Ave
- 904 E Blackshear Ave
- 907 E Blackshear Ave
- 1025 E Blackshear Ave
- 2409 Eastover Dr
- 2411 Eastover Dr
- 2407 Eastover Dr
- 902 E Blackshear Ave
- 905 E Blackshear Ave
- 2010 Neal St
- 2405 Eastover Dr
- 2403 Eastover Dr
- 2012 Neal St
- 2003 Fairway Dr
Your Personal Tour Guide
Ask me questions while you tour the home.