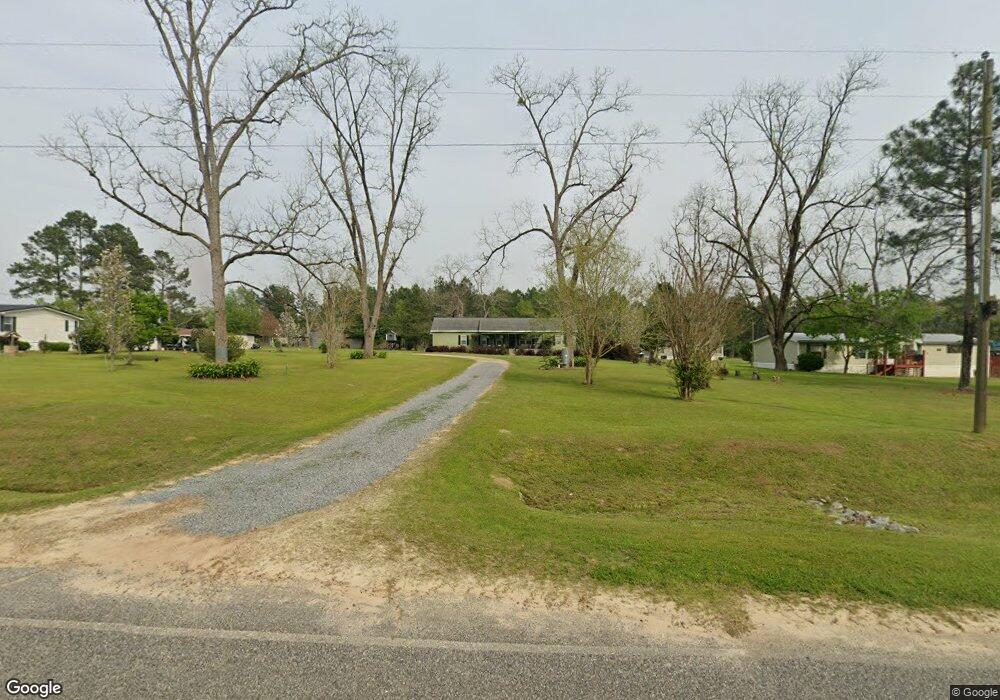
Estimated Value: $281,538 - $373,000
3
Beds
3
Baths
2,280
Sq Ft
$141/Sq Ft
Est. Value
About This Home
This home is located at 930 Moore Rd, Cairo, GA 39828 and is currently estimated at $321,885, approximately $141 per square foot. 930 Moore Rd is a home located in Grady County.
Ownership History
Date
Name
Owned For
Owner Type
Purchase Details
Closed on
Oct 26, 2020
Sold by
Patten Lana H
Bought by
Patten Lana H and Horne Oscar Gerald
Current Estimated Value
Home Financials for this Owner
Home Financials are based on the most recent Mortgage that was taken out on this home.
Original Mortgage
$165,200
Outstanding Balance
$144,324
Interest Rate
2.9%
Mortgage Type
New Conventional
Estimated Equity
$177,561
Purchase Details
Closed on
May 11, 2010
Sold by
Patten Lana
Bought by
Patten Lana H and Patten Gerald N
Purchase Details
Closed on
Mar 23, 2010
Sold by
Horne Oscar G
Bought by
Patten Lana
Create a Home Valuation Report for This Property
The Home Valuation Report is an in-depth analysis detailing your home's value as well as a comparison with similar homes in the area
Purchase History
| Date | Buyer | Sale Price | Title Company |
|---|---|---|---|
| Patten Lana H | -- | -- | |
| Patten Lana H | -- | -- | |
| Patten Lana H | -- | -- | |
| Patten Lana | -- | -- |
Source: Public Records
Mortgage History
| Date | Status | Borrower | Loan Amount |
|---|---|---|---|
| Open | Patten Lana H | $165,200 |
Source: Public Records
Tax History
| Year | Tax Paid | Tax Assessment Tax Assessment Total Assessment is a certain percentage of the fair market value that is determined by local assessors to be the total taxable value of land and additions on the property. | Land | Improvement |
|---|---|---|---|---|
| 2025 | $2,173 | $116,809 | $1,854 | $114,955 |
| 2024 | $2,173 | $90,927 | $1,854 | $89,073 |
| 2023 | $1,589 | $53,635 | $2,016 | $51,619 |
| 2022 | $1,589 | $53,635 | $2,016 | $51,619 |
| 2021 | $1,595 | $53,635 | $2,016 | $51,619 |
| 2020 | $1,600 | $53,635 | $2,016 | $51,619 |
| 2019 | $1,600 | $53,635 | $2,016 | $51,619 |
| 2018 | $1,502 | $53,635 | $2,016 | $51,619 |
| 2017 | $1,430 | $53,635 | $2,016 | $51,619 |
| 2016 | $1,203 | $45,187 | $2,016 | $43,171 |
| 2015 | $1,188 | $45,187 | $2,016 | $43,171 |
| 2014 | $1,190 | $45,187 | $2,016 | $43,171 |
| 2013 | -- | $47,910 | $3,600 | $44,310 |
Source: Public Records
Map
Nearby Homes
Your Personal Tour Guide
Ask me questions while you tour the home.