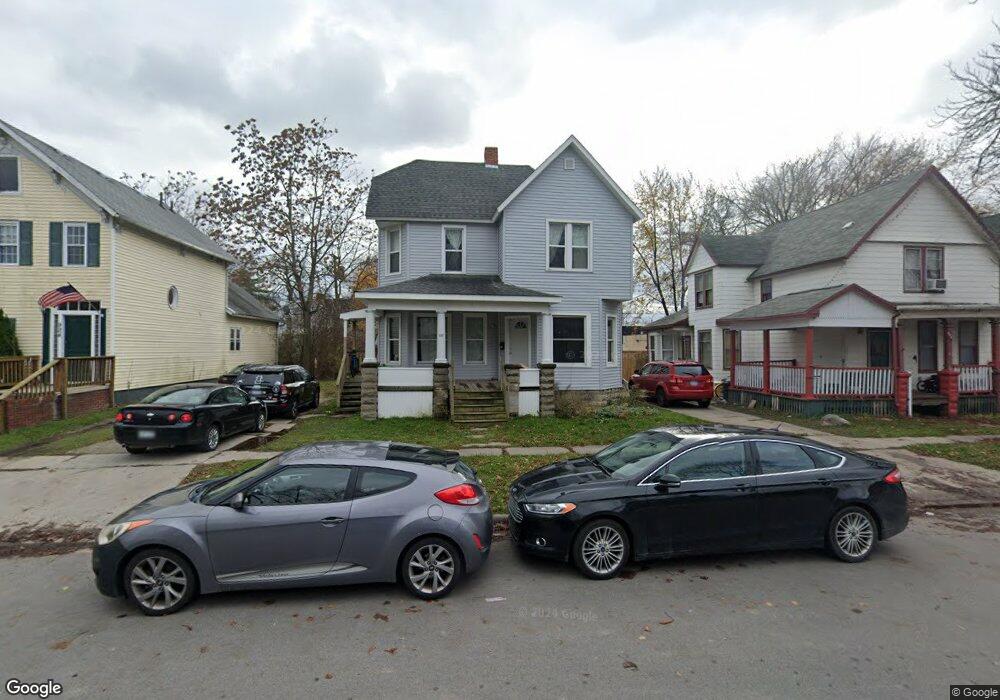
930 Wall St Port Huron, MI 48060
Estimated Value: $129,000 - $169,838
4
Beds
2
Baths
2,088
Sq Ft
$75/Sq Ft
Est. Value
About This Home
This home is located at 930 Wall St, Port Huron, MI 48060 and is currently estimated at $156,960, approximately $75 per square foot. 930 Wall St is a home located in St. Clair County with nearby schools including Woodrow Wilson Elementary School, Holland Woods Middle School, and Port Huron High School.
Ownership History
Date
Name
Owned For
Owner Type
Purchase Details
Closed on
Nov 30, 2023
Sold by
Hux John
Bought by
Antoszewski Avery
Current Estimated Value
Purchase Details
Closed on
May 14, 2019
Sold by
Tenniswood Timothy
Bought by
Ttj Investments Llc
Purchase Details
Closed on
Dec 27, 2016
Sold by
Jawor Raphael A and Jawor Linda J
Bought by
Hux John and Tenniswood Tim
Home Financials for this Owner
Home Financials are based on the most recent Mortgage that was taken out on this home.
Original Mortgage
$41,300
Interest Rate
4.08%
Mortgage Type
Future Advance Clause Open End Mortgage
Create a Home Valuation Report for This Property
The Home Valuation Report is an in-depth analysis detailing your home's value as well as a comparison with similar homes in the area
Home Values in the Area
Average Home Value in this Area
Purchase History
| Date | Buyer | Sale Price | Title Company |
|---|---|---|---|
| Antoszewski Avery | $160,000 | None Listed On Document | |
| Ttj Investments Llc | -- | Huron Title Co | |
| Hux John | $40,000 | None Available |
Source: Public Records
Mortgage History
| Date | Status | Borrower | Loan Amount |
|---|---|---|---|
| Previous Owner | Hux John | $41,300 |
Source: Public Records
Tax History
| Year | Tax Paid | Tax Assessment Tax Assessment Total Assessment is a certain percentage of the fair market value that is determined by local assessors to be the total taxable value of land and additions on the property. | Land | Improvement |
|---|---|---|---|---|
| 2025 | $3,416 | $63,000 | $0 | $0 |
| 2024 | $3,148 | $59,600 | $0 | $0 |
| 2023 | $1,788 | $53,500 | $0 | $0 |
| 2022 | $1,784 | $42,500 | $0 | $0 |
| 2020 | $1,710 | $33,800 | $33,800 | $0 |
| 2019 | $1,680 | $25,100 | $0 | $0 |
| 2018 | $1,642 | $25,100 | $0 | $0 |
| 2017 | $1,507 | $24,200 | $0 | $0 |
| 2016 | $1,224 | $24,200 | $0 | $0 |
| 2015 | $1,296 | $23,500 | $23,500 | $0 |
| 2014 | $1,296 | $22,300 | $22,300 | $0 |
| 2013 | -- | $22,400 | $0 | $0 |
Source: Public Records
Map
Nearby Homes
Your Personal Tour Guide
Ask me questions while you tour the home.