933 Main St Bolton, MA 01740
Estimated Value: $709,000 - $808,000
About This Home
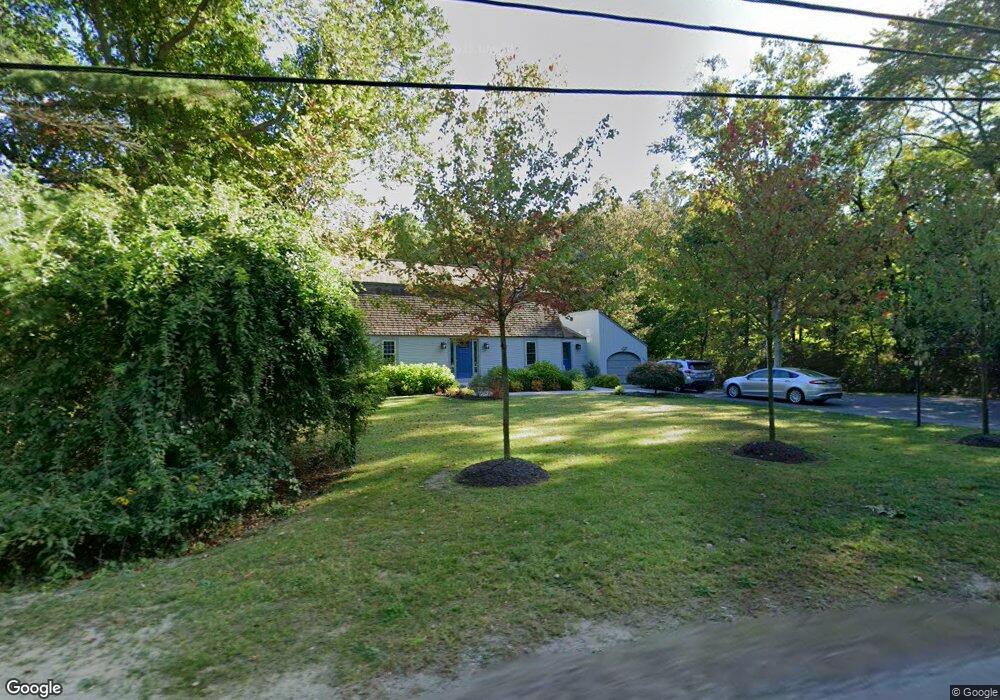
This home is located at 933 Main St, Bolton, MA 01740 and is currently estimated at $753,341, approximately $383 per square foot. 933 Main St is a home located in Worcester County with nearby schools including Florence Sawyer School, Nashoba Regional High School, and South Lancaster Academy.
Ownership History
We collect this data history from publicly available records. To have your information removed, we recommend requesting removal directly through your county’s website.
Purchase Details
Purchase Details
Home Financials for this Owner
Home Financials are based on the most recent Mortgage that was taken out on this home.Purchase Details
Home Values in the Area
Average Home Value in this Area
Purchase History
We collect this data history from publicly available records. To have your information removed, we recommend requesting removal directly through your county’s website.
| Date | Buyer | Sale Price | Title Company |
|---|---|---|---|
| -- | -- | ||
| -- | -- | ||
| $15,000 | -- |
Mortgage History
We collect this data history from publicly available records. To have your information removed, we recommend requesting removal directly through your county’s website.
| Date | Status | Borrower | Loan Amount |
|---|---|---|---|
| Previous Owner | $236,000 | ||
| Previous Owner | $56,800 | ||
| Previous Owner | $235,500 |
Tax History
We collect this data history from publicly available records. To have your information removed, we recommend requesting removal directly through your county’s website.
| Year | Tax Paid | Tax Assessment Tax Assessment Total Assessment is a certain percentage of the fair market value that is determined by local assessors to be the total taxable value of land and additions on the property. | Land | Improvement |
|---|---|---|---|---|
| 2025 | $10,773 | $648,200 | $172,700 | $475,500 |
| 2024 | $10,340 | $635,900 | $162,900 | $473,000 |
| 2023 | $9,874 | $564,200 | $162,900 | $401,300 |
| 2022 | $8,592 | $432,400 | $158,000 | $274,400 |
| 2021 | $8,377 | $401,600 | $148,300 | $253,300 |
| 2020 | $7,860 | $385,500 | $148,200 | $237,300 |
| 2019 | $7,662 | $374,300 | $148,200 | $226,100 |
| 2018 | $7,210 | $349,000 | $124,300 | $224,700 |
| 2017 | $6,820 | $321,700 | $109,900 | $211,800 |
| 2016 | $6,865 | $328,300 | $119,500 | $208,800 |
| 2015 | $6,928 | $330,200 | $124,300 | $205,900 |
| 2014 | $7,036 | $331,900 | $138,600 | $193,300 |
Map
- 36 Pondside Dr
- 91 Green Rd
- 99 Nourse Rd
- 1100 Main St
- 97 Fox Run Rd
- 31 Manor Rd
- 2 Sanders Ln
- 16 Mallard Ln Unit 3
- 269 Harvard Rd
- 385 Green Rd
- 2 Old Harvard Rd
- 57 Berlin Rd
- 54 Main St
- 158 Kettle Hole Rd
- 58 Sunset Ridge Ln Unit U:58
- 60 Sugar Rd
- 57 Houghton Farm Ln
- 123 Sugar Rd
- 88 Drumlin Hill Rd
- 236 Bolton Rd
Ask me questions while you tour the home.