933 Pine St Waukegan, IL 60085
Waukegan Gardens NeighborhoodEstimated Value: $161,000 - $180,208
About This Home
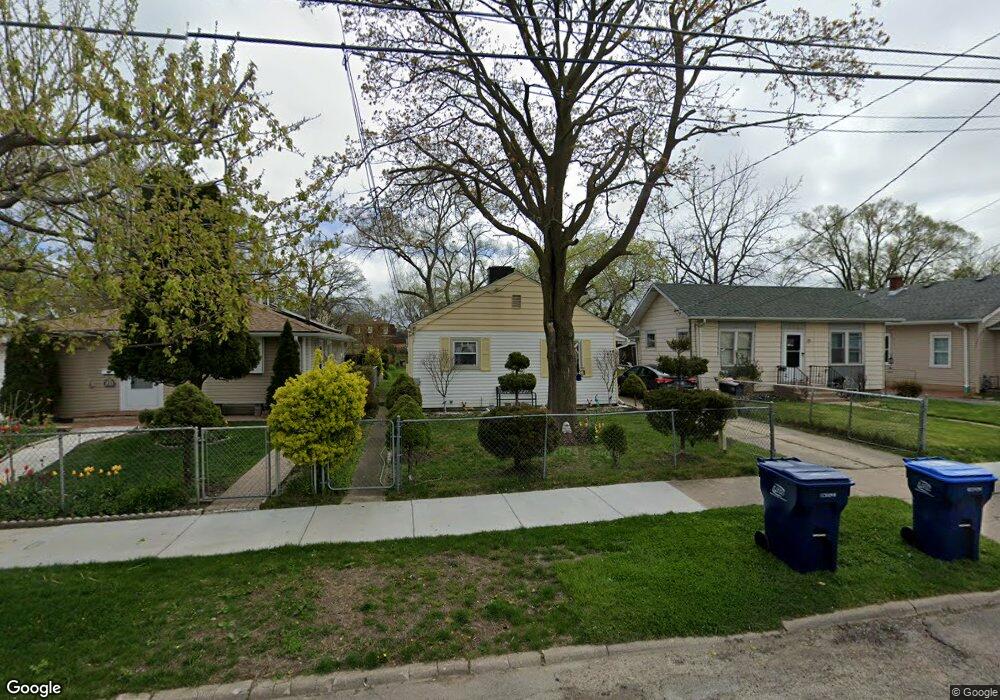
This home is located at 933 Pine St, Waukegan, IL 60085 and is currently estimated at $171,302, approximately $223 per square foot. 933 Pine St is a home located in Lake County with nearby schools including Glen Flora Elementary School, Edith M Smith Middle School, and Waukegan High School.
Ownership History
We collect this data history from publicly available records. To have your information removed, we recommend requesting removal directly through your county’s website.
Purchase Details
Home Financials for this Owner
Home Financials are based on the most recent Mortgage that was taken out on this home.Purchase Details
Home Values in the Area
Average Home Value in this Area
Purchase History
We collect this data history from publicly available records. To have your information removed, we recommend requesting removal directly through your county’s website.
| Date | Buyer | Sale Price | Title Company |
|---|---|---|---|
| $72,000 | -- | ||
| $48,000 | -- |
Mortgage History
We collect this data history from publicly available records. To have your information removed, we recommend requesting removal directly through your county’s website.
| Date | Status | Borrower | Loan Amount |
|---|---|---|---|
| Open | $71,889 | ||
| Closed | $2,875 |
Tax History
We collect this data history from publicly available records. To have your information removed, we recommend requesting removal directly through your county’s website.
| Year | Tax Paid | Tax Assessment Tax Assessment Total Assessment is a certain percentage of the fair market value that is determined by local assessors to be the total taxable value of land and additions on the property. | Land | Improvement |
|---|---|---|---|---|
| 2025 | $2,673 | $41,672 | $9,473 | $32,199 |
| 2024 | $2,554 | $38,800 | $8,820 | $29,980 |
| 2023 | $2,499 | $35,080 | $7,974 | $27,106 |
| 2022 | $2,499 | $31,559 | $6,093 | $25,466 |
| 2021 | $2,090 | $26,051 | $5,327 | $20,724 |
| 2020 | $2,071 | $24,270 | $4,963 | $19,307 |
| 2019 | $2,032 | $22,240 | $4,548 | $17,692 |
| 2018 | $1,663 | $19,247 | $5,722 | $13,525 |
| 2017 | $1,580 | $17,028 | $5,062 | $11,966 |
| 2016 | $1,359 | $14,797 | $4,399 | $10,398 |
| 2015 | $1,224 | $13,243 | $3,937 | $9,306 |
| 2014 | $1,322 | $13,351 | $3,068 | $10,283 |
| 2012 | $2,125 | $14,463 | $3,323 | $11,140 |
Map
- 918 N Linden Ave
- 825 N Butrick St
- 850 N Jackson St
- 909 Highland Ave
- 916 Chestnut St
- 968 Judge Ave
- 968 Lorraine Ave
- 1504 W Glen Flora Ave
- 801 Indiana Ave
- 634 W Ridgeland Ave
- 1318 N Jackson St
- 1005 N Lewis Ave
- 1009 Westmoreland Ave
- 1411 N Jackson St
- 3221 & 3241 W Glen Flora Ave
- 1213 Grand Ave
- 1006 Rogers Ct
- 416 Hull Ct
- 12787 W Grove Ave
- 1527 Brookside Ave
Ask me questions while you tour the home.