935 High St Bucyrus, OH 44820
Estimated Value: $118,000 - $147,404
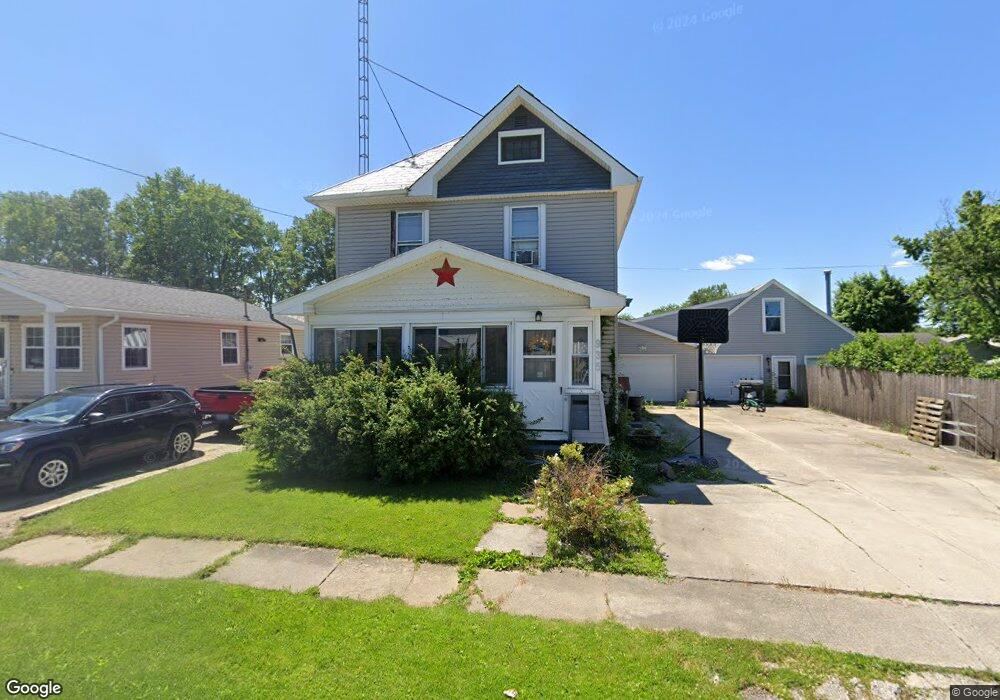
About This Home
This home is located at 935 High St, Bucyrus, OH 44820 and is currently estimated at $133,351, approximately $167 per square foot. 935 High St is a home located in Crawford County with nearby schools including Bucyrus Elementary School, Bucyrus Secondary School, and Holy Trinity School.
Ownership History
We collect this data history from publicly available records. To have your information removed, we recommend requesting removal directly through your county’s website.
Purchase Details
Purchase Details
Home Financials for this Owner
Home Financials are based on the most recent Mortgage that was taken out on this home.Home Values in the Area
Average Home Value in this Area
Purchase History
We collect this data history from publicly available records. To have your information removed, we recommend requesting removal directly through your county’s website.
| Date | Buyer | Sale Price | Title Company |
|---|---|---|---|
| -- | Old Crawford Land Title | ||
| $69,500 | Acs Title Bucyrus |
Mortgage History
We collect this data history from publicly available records. To have your information removed, we recommend requesting removal directly through your county’s website.
| Date | Status | Borrower | Loan Amount |
|---|---|---|---|
| Previous Owner | $68,240 |
Tax History
We collect this data history from publicly available records. To have your information removed, we recommend requesting removal directly through your county’s website.
| Year | Tax Paid | Tax Assessment Tax Assessment Total Assessment is a certain percentage of the fair market value that is determined by local assessors to be the total taxable value of land and additions on the property. | Land | Improvement |
|---|---|---|---|---|
| 2025 | $1,454 | $32,680 | $1,470 | $31,210 |
| 2024 | $1,454 | $32,680 | $1,470 | $31,210 |
| 2023 | $1,474 | $21,440 | $1,470 | $19,970 |
| 2022 | $1,144 | $21,440 | $1,470 | $19,970 |
| 2021 | $1,141 | $21,440 | $1,470 | $19,970 |
| 2020 | $1,152 | $20,520 | $1,470 | $19,050 |
| 2019 | $1,178 | $20,520 | $1,470 | $19,050 |
| 2018 | $1,173 | $20,520 | $1,470 | $19,050 |
| 2017 | $1,045 | $17,650 | $1,470 | $16,180 |
| 2016 | $1,013 | $17,650 | $1,470 | $16,180 |
| 2015 | $999 | $17,650 | $1,470 | $16,180 |
| 2014 | $995 | $17,650 | $1,470 | $16,180 |
| 2013 | $995 | $17,650 | $1,470 | $16,180 |
Map
- 935 High St
- 909 Maple St
- 1018 Wingert St
- 124 Songer Ave
- 1120 N Sandusky Ave
- 116 Melcher Blvd
- 915 E Mansfield St
- 407 E Mansfield St
- 903 Reid St
- 941 Reid St
- 1001 Reid St
- 412 E Rensselaer St
- 317 E Rensselaer St
- 223 E Rensselaer St
- 1023 Tiffin St Unit Lot 5
- 1023 Tiffin St Unit 17
- 1023 Tiffin St Unit 30
- 400 W Mansfield St
- 259 Nauman St
- 1023
Ask me questions while you tour the home.