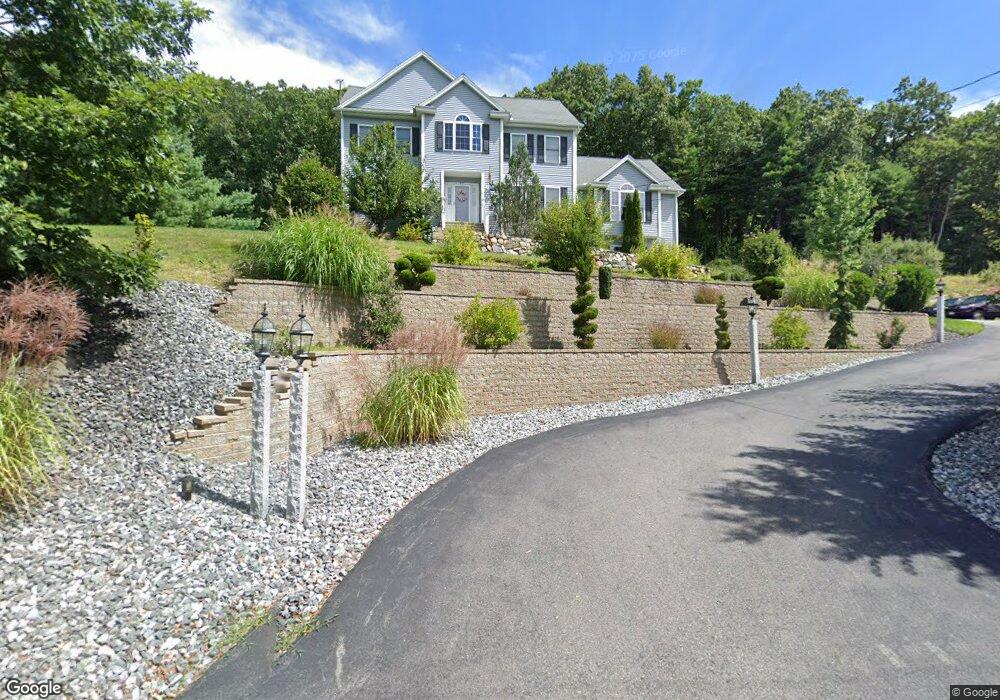
935 Salem Rd Dracut, MA 01826
Estimated Value: $773,000 - $980,000
About This Home
This home is located at 935 Salem Rd, Dracut, MA 01826 and is currently estimated at $854,041, approximately $299 per square foot. 935 Salem Rd is a home located in Middlesex County with nearby schools including Joseph A. Campbell Elementary School, Richardson Middle School, and Dracut Senior High School.
Ownership History
We collect this data history from publicly available records. To have your information removed, we recommend requesting removal directly through your county’s website.
Purchase Details
Purchase Details
Home Financials for this Owner
Home Financials are based on the most recent Mortgage that was taken out on this home.Home Values in the Area
Average Home Value in this Area
Purchase History
We collect this data history from publicly available records. To have your information removed, we recommend requesting removal directly through your county’s website.
| Date | Buyer | Sale Price | Title Company |
|---|---|---|---|
| -- | -- | ||
| $500,000 | -- | ||
| $500,000 | -- |
Mortgage History
We collect this data history from publicly available records. To have your information removed, we recommend requesting removal directly through your county’s website.
| Date | Status | Borrower | Loan Amount |
|---|---|---|---|
| Previous Owner | $148,600 | ||
| Previous Owner | $205,000 | ||
| Previous Owner | $50,000 | ||
| Previous Owner | $205,000 |
Tax History
We collect this data history from publicly available records. To have your information removed, we recommend requesting removal directly through your county’s website.
| Year | Tax Paid | Tax Assessment Tax Assessment Total Assessment is a certain percentage of the fair market value that is determined by local assessors to be the total taxable value of land and additions on the property. | Land | Improvement |
|---|---|---|---|---|
| 2025 | $8,098 | $800,200 | $252,800 | $547,400 |
| 2024 | $7,887 | $754,700 | $240,900 | $513,800 |
| 2023 | $7,646 | $660,300 | $209,700 | $450,600 |
| 2022 | $7,574 | $616,300 | $192,300 | $424,000 |
| 2021 | $7,279 | $559,500 | $176,200 | $383,300 |
| 2020 | $7,031 | $526,700 | $171,400 | $355,300 |
| 2019 | $6,768 | $492,200 | $164,000 | $328,200 |
| 2018 | $6,760 | $478,100 | $164,000 | $314,100 |
| 2017 | $6,686 | $478,100 | $164,000 | $314,100 |
| 2016 | $6,552 | $441,500 | $158,300 | $283,200 |
| 2015 | $6,335 | $424,300 | $158,300 | $266,000 |
| 2014 | $5,935 | $409,600 | $158,300 | $251,300 |
Map
- 24 Piper Ln
- 99 Harris St
- 17 Carmel Rd
- 7 Ballard Rd
- 32 Honor Roll Rd
- 3 Surrey Ln
- 26 Lamplighter Ln
- 5 Falcon Dr
- 6 Colby Ln
- 25 Ticklefancy Ln
- 294 Salem Rd
- 385 Old Gage Hill Rd
- 335 Pelham Rd
- 1152 Bridge St
- 50 Webster Ave
- 18 Meredith Ln Unit 18
- 5 Meredith Ln Unit 5
- 7 Meredith Ln Unit 7
- 3 Meredith Ln Unit 3
- 1 Meredith Ln
Ask me questions while you tour the home.