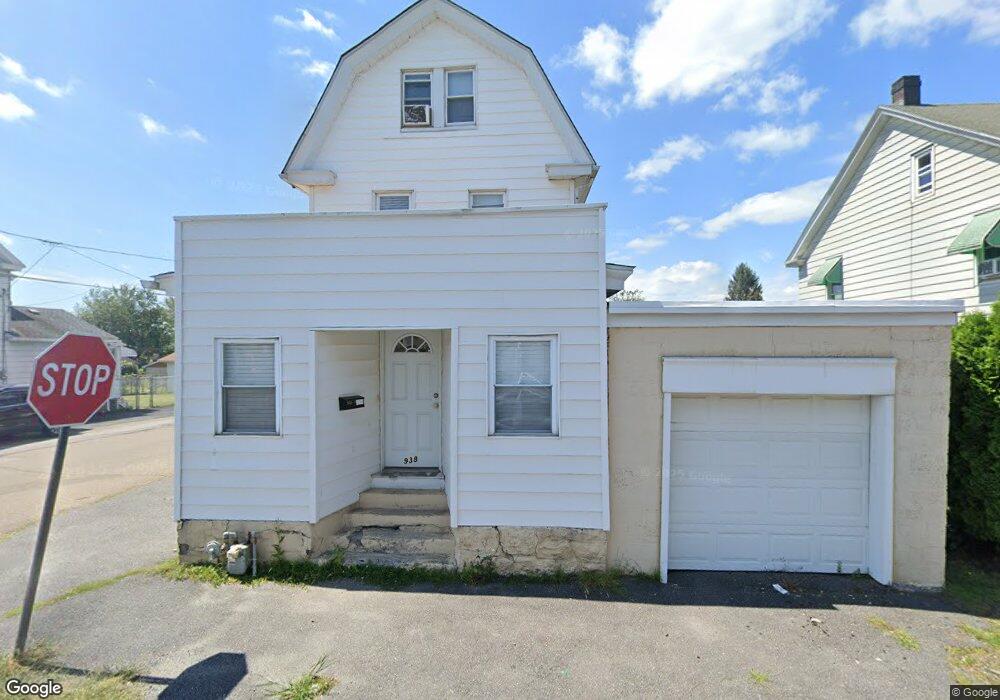
938 N James St Hazleton, PA 18201
Estimated Value: $124,769 - $201,000
Studio
--
Bath
1,768
Sq Ft
$91/Sq Ft
Est. Value
About This Home
This home is located at 938 N James St, Hazleton, PA 18201 and is currently estimated at $160,942, approximately $91 per square foot. 938 N James St is a home located in Luzerne County with nearby schools including Hazleton Area High School, Immanuel Christian School, and Bishop Hafey Junior/Senior High School.
Ownership History
Date
Name
Owned For
Owner Type
Purchase Details
Closed on
Apr 26, 2024
Sold by
Zola Daniel and Zola Sybill
Bought by
G & B Realty Llc
Current Estimated Value
Home Financials for this Owner
Home Financials are based on the most recent Mortgage that was taken out on this home.
Original Mortgage
$2,360,000
Outstanding Balance
$2,312,467
Interest Rate
6.74%
Mortgage Type
Seller Take Back
Estimated Equity
-$2,151,525
Purchase Details
Closed on
Sep 17, 2008
Sold by
Sutton Funding Llc
Bought by
Zola Daniel and Zola Sybill
Purchase Details
Closed on
Mar 31, 2008
Sold by
Nika Steva and Nika Veronica
Bought by
Sutton Funding Llc
Create a Home Valuation Report for This Property
The Home Valuation Report is an in-depth analysis detailing your home's value as well as a comparison with similar homes in the area
Home Values in the Area
Average Home Value in this Area
Purchase History
| Date | Buyer | Sale Price | Title Company |
|---|---|---|---|
| G & B Realty Llc | $115,000 | Covenant Abstract | |
| Zola Daniel | $37,000 | None Available | |
| Sutton Funding Llc | $2,168 | None Available |
Source: Public Records
Mortgage History
| Date | Status | Borrower | Loan Amount |
|---|---|---|---|
| Open | G & B Realty Llc | $2,360,000 |
Source: Public Records
Tax History
| Year | Tax Paid | Tax Assessment Tax Assessment Total Assessment is a certain percentage of the fair market value that is determined by local assessors to be the total taxable value of land and additions on the property. | Land | Improvement |
|---|---|---|---|---|
| 2026 | $1,232 | $60,000 | $20,900 | $39,100 |
| 2025 | $1,723 | $60,000 | $20,900 | $39,100 |
| 2024 | $1,615 | $60,000 | $20,900 | $39,100 |
| 2023 | $1,510 | $60,000 | $20,900 | $39,100 |
| 2022 | $1,498 | $60,000 | $20,900 | $39,100 |
| 2021 | $1,464 | $60,000 | $20,900 | $39,100 |
| 2020 | $1,308 | $60,000 | $20,900 | $39,100 |
| 2019 | $1,349 | $60,000 | $20,900 | $39,100 |
| 2018 | $1,304 | $60,000 | $20,900 | $39,100 |
| 2017 | $1,202 | $60,000 | $20,900 | $39,100 |
| 2016 | $854 | $60,000 | $20,900 | $39,100 |
| 2015 | -- | $60,000 | $20,900 | $39,100 |
| 2014 | -- | $60,000 | $20,900 | $39,100 |
Source: Public Records
Map
Nearby Homes
- 829 W 21st St
- 1087 Lafayette Ct
- 845 N Vine St
- 0 Church Unit PALU2002778
- 1028 Pennsylvania 940
- 0 Lincoln St
- 2 W 17th St
- 403 W 7th St
- 0 Liberty Ct
- 550 Allen St
- 608 Mckinley St
- 991 Seybert St
- 911 Seybert St
- 397 W 30th St
- 239 E 23rd St
- 14 W 4th St
- 7 W Diamond Ave
- 1 W Diamond Ave
- 631 Perry Ct
- 475 W Broad St
Your Personal Tour Guide
Ask me questions while you tour the home.