94 Linbert St Middletown, CT 06457
Estimated Value: $334,000 - $435,393
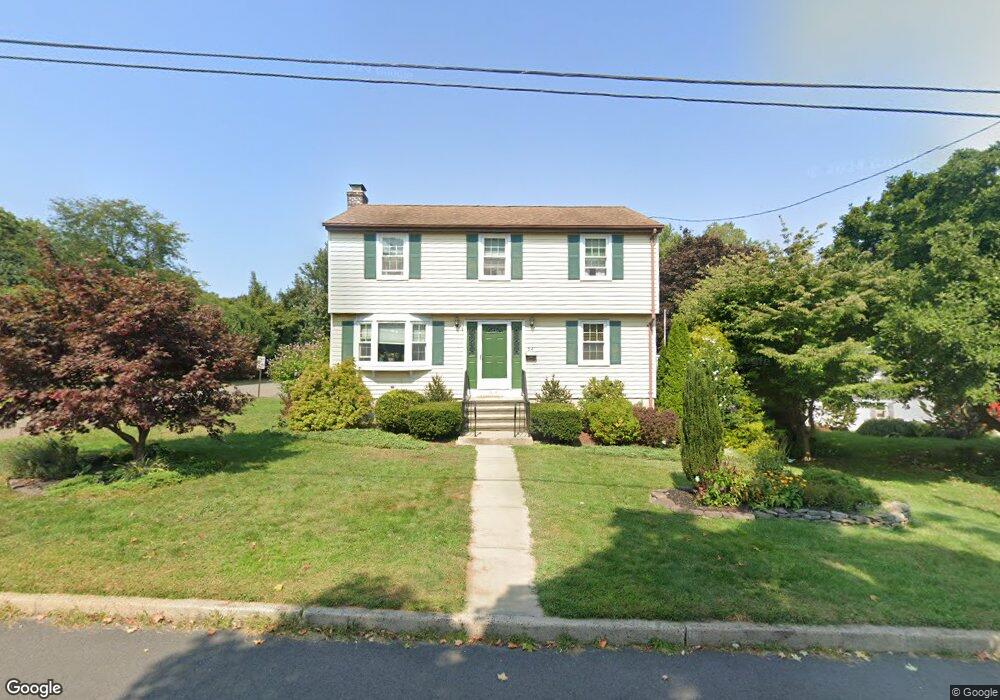
About This Home
This home is located at 94 Linbert St, Middletown, CT 06457 and is currently estimated at $402,848, approximately $256 per square foot. 94 Linbert St is a home located in Middlesex County with nearby schools including Farm Hill School, Middletown High School, and St John Paul II School.
Ownership History
We collect this data history from publicly available records. To have your information removed, we recommend requesting removal directly through your county’s website.
Purchase Details
Home Financials for this Owner
Home Financials are based on the most recent Mortgage that was taken out on this home.Purchase History
We collect this data history from publicly available records. To have your information removed, we recommend requesting removal directly through your county’s website.
| Date | Buyer | Sale Price | Title Company |
|---|---|---|---|
| $167,000 | -- |
Mortgage History
We collect this data history from publicly available records. To have your information removed, we recommend requesting removal directly through your county’s website.
| Date | Status | Borrower | Loan Amount |
|---|---|---|---|
| Closed | $122,000 | ||
| Closed | $133,600 | ||
| Previous Owner | $27,000 |
Tax History
We collect this data history from publicly available records. To have your information removed, we recommend requesting removal directly through your county’s website.
| Year | Tax Paid | Tax Assessment Tax Assessment Total Assessment is a certain percentage of the fair market value that is determined by local assessors to be the total taxable value of land and additions on the property. | Land | Improvement |
|---|---|---|---|---|
| 2025 | $8,586 | $231,990 | $61,580 | $170,410 |
| 2024 | $8,215 | $231,990 | $61,580 | $170,410 |
| 2023 | $7,797 | $231,990 | $61,580 | $170,410 |
| 2022 | $7,147 | $173,240 | $41,060 | $132,180 |
| 2021 | $7,115 | $173,240 | $41,060 | $132,180 |
| 2020 | $7,103 | $173,240 | $41,060 | $132,180 |
| 2019 | $7,138 | $173,240 | $41,060 | $132,180 |
| 2018 | $6,892 | $173,240 | $41,060 | $132,180 |
| 2017 | $6,315 | $163,250 | $47,500 | $115,750 |
| 2016 | $6,188 | $163,250 | $47,500 | $115,750 |
| 2015 | $6,051 | $163,250 | $47,500 | $115,750 |
| 2014 | $6,045 | $163,250 | $47,500 | $115,750 |
Map
- 40 Hillcrest Ave
- 2 Hillside Ct
- 210 Ridge Rd
- 6 Hillside Ct
- 56 Bidwell Terrace
- 50 Garfield Ave
- 30 Snipes Terrace
- 121 Saybrook Rd
- 57 Ridge Rd
- 42 Saybrook Rd
- 60 Warner Ave
- 72 Durant Terrace
- 38 Harris St
- 58 Durant Terrace
- 19 Kent Ct
- 315 E Ridge Rd
- 227 E Main St
- 36 Hunting Hill Ave
- 7 Evergreen Ave
- 234 S Main St Unit 416
Ask me questions while you tour the home.