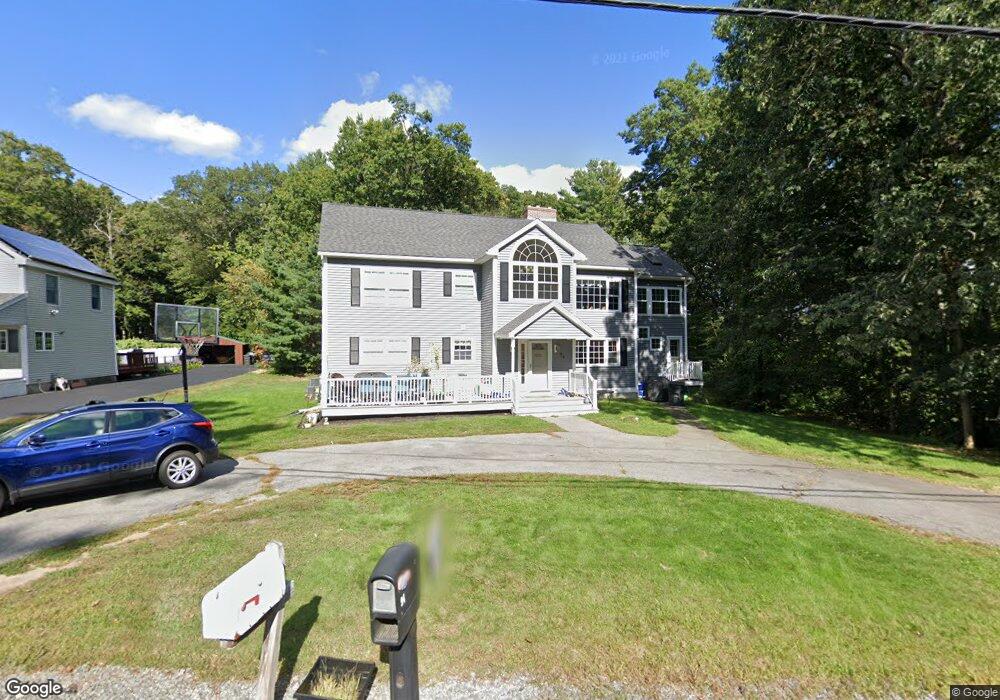
94 Myrtle St Methuen, MA 01844
The West End NeighborhoodEstimated Value: $752,000 - $830,000
3
Beds
2
Baths
2,784
Sq Ft
$284/Sq Ft
Est. Value
About This Home
This home is located at 94 Myrtle St, Methuen, MA 01844 and is currently estimated at $790,423, approximately $283 per square foot. 94 Myrtle St is a home located in Essex County with nearby schools including Marsh Grammar School, Methuen High School, and The Islamic Academy For Peace.
Ownership History
Date
Name
Owned For
Owner Type
Purchase Details
Closed on
Jan 4, 2010
Sold by
Sunderland 1 Ft and Sunderland
Bought by
Delano Alan and Delano Tracey
Current Estimated Value
Home Financials for this Owner
Home Financials are based on the most recent Mortgage that was taken out on this home.
Original Mortgage
$273,000
Outstanding Balance
$176,886
Interest Rate
4.85%
Mortgage Type
Purchase Money Mortgage
Estimated Equity
$613,537
Create a Home Valuation Report for This Property
The Home Valuation Report is an in-depth analysis detailing your home's value as well as a comparison with similar homes in the area
Home Values in the Area
Average Home Value in this Area
Purchase History
We collect this data history from publicly available records. To have your information removed, we recommend requesting removal directly through your county’s website.
| Date | Buyer | Sale Price | Title Company |
|---|---|---|---|
| Delano Alan | $273,000 | -- | |
| Delano Alan | $273,000 | -- | |
| Sunderland Ann L | -- | -- | |
| Delano Alan | $273,000 | -- |
Source: Public Records
Mortgage History
We collect this data history from publicly available records. To have your information removed, we recommend requesting removal directly through your county’s website.
| Date | Status | Borrower | Loan Amount |
|---|---|---|---|
| Open | Delano Alan | $273,000 | |
| Closed | Delano Alan | $273,000 | |
| Closed | Delano Alan | $0 | |
| Previous Owner | Delano Alan | $267,200 |
Source: Public Records
Tax History
| Year | Tax Paid | Tax Assessment Tax Assessment Total Assessment is a certain percentage of the fair market value that is determined by local assessors to be the total taxable value of land and additions on the property. | Land | Improvement |
|---|---|---|---|---|
| 2025 | $8,214 | $776,400 | $304,900 | $471,500 |
| 2024 | $8,032 | $739,600 | $278,100 | $461,500 |
| 2023 | $7,733 | $660,900 | $247,200 | $413,700 |
| 2022 | $7,303 | $559,600 | $206,000 | $353,600 |
| 2021 | $6,865 | $520,500 | $195,700 | $324,800 |
| 2020 | $6,802 | $506,100 | $195,700 | $310,400 |
| 2019 | $6,492 | $457,500 | $175,100 | $282,400 |
| 2018 | $6,322 | $443,000 | $175,100 | $267,900 |
| 2017 | $6,135 | $418,800 | $175,100 | $243,700 |
| 2016 | $5,977 | $403,600 | $164,800 | $238,800 |
| 2015 | $5,653 | $387,200 | $164,800 | $222,400 |
Source: Public Records
Map
Nearby Homes
- 298 Salem Rd
- 302 Salem Rd
- 100 Salem Rd
- 3 Avalon Ct
- 21 Newhill Rd
- 16 Newhill Rd
- 3 College Ln
- 40 Hillcrest Ave
- 35 Ponderosa Ave
- 29 Heather Dr Unit 34
- 5 Cobblestone Rd
- 26 Hobson St
- 35 Canobieola Rd
- 8 Carmel Rd
- 1 Silver Brook Rd
- 67 Sherwood Dr Unit 67
- 2 Hopkins Cir Unit 2
- 2 Canobieola Rd
- 89 Edgewood Ave
- 785 Broadway Rd
Your Personal Tour Guide
Ask me questions while you tour the home.