943 Sprague St Edmonds, WA 98020
Edmonds Bowl NeighborhoodEstimated Value: $1,121,962 - $1,334,000
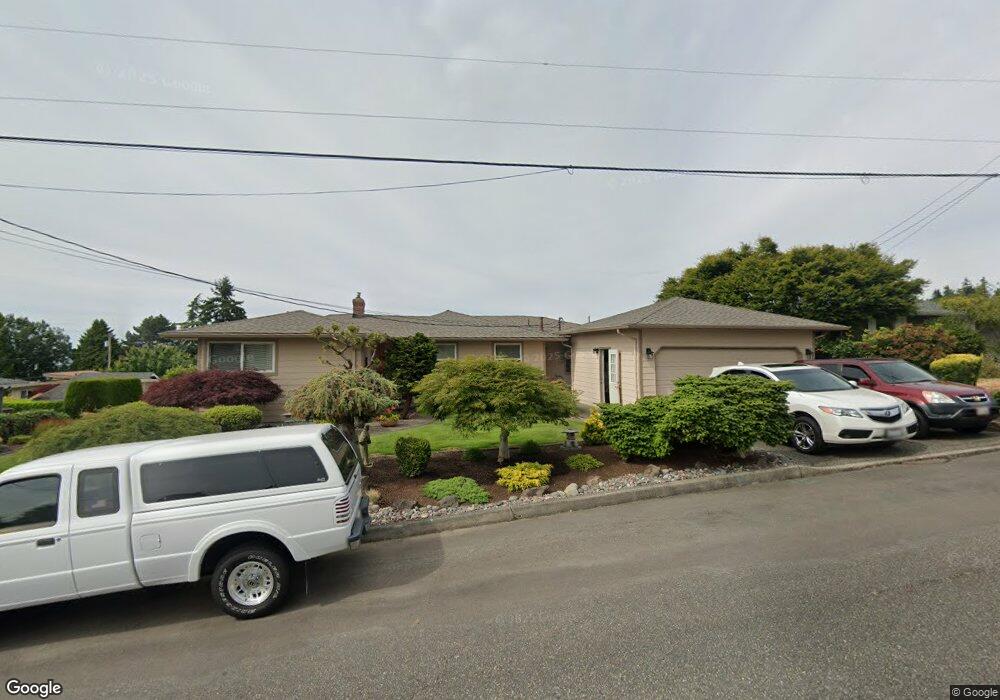
About This Home
This home is located at 943 Sprague St, Edmonds, WA 98020 and is currently estimated at $1,227,741, approximately $971 per square foot. 943 Sprague St is a home located in Snohomish County with nearby schools including Edmonds Elementary School, College Place Middle School, and Edmonds-Woodway High School.
Ownership History
We collect this data history from publicly available records. To have your information removed, we recommend requesting removal directly through your county’s website.
Purchase Details
Home Values in the Area
Average Home Value in this Area
Purchase History
We collect this data history from publicly available records. To have your information removed, we recommend requesting removal directly through your county’s website.
| Date | Buyer | Sale Price | Title Company |
|---|---|---|---|
| $205,000 | Chicago Title Insurance Co |
Tax History
We collect this data history from publicly available records. To have your information removed, we recommend requesting removal directly through your county’s website.
| Year | Tax Paid | Tax Assessment Tax Assessment Total Assessment is a certain percentage of the fair market value that is determined by local assessors to be the total taxable value of land and additions on the property. | Land | Improvement |
|---|---|---|---|---|
| 2026 | $1,430 | $1,181,300 | $963,900 | $217,400 |
| 2025 | $1,160 | $1,110,800 | $903,200 | $207,600 |
| 2024 | $1,160 | $1,026,400 | $818,800 | $207,600 |
| 2023 | $2,796 | $1,229,800 | $1,021,200 | $208,600 |
| 2022 | $3,405 | $943,400 | $764,700 | $178,700 |
| 2020 | $3,727 | $805,700 | $651,100 | $154,600 |
| 2019 | $7,298 | $787,200 | $633,800 | $153,400 |
| 2018 | $7,233 | $674,100 | $535,900 | $138,200 |
| 2017 | $6,288 | $613,100 | $483,000 | $130,100 |
| 2016 | $5,422 | $523,800 | $398,400 | $125,400 |
| 2015 | $5,269 | $479,300 | $375,400 | $103,900 |
| 2013 | $4,674 | $401,000 | $314,600 | $86,400 |
Map
- 1011 Carol Way
- 1010 Main St
- 622 Olympic Ave
- 103 8th Ave S
- 227 Highland Dr
- 603 7th Ave N Unit A204
- 655 Main St Unit 305
- 310 Skyline Dr
- 1021 Walnut St
- 911 Brookmere St
- 709 Maple St
- 610 Daley St Unit E
- 816 Walnut St
- 631 Giltner Ln
- 510 3rd Ave N
- 228 4th Ave N
- 809 Spruce Place
- 428 3rd Ave N
- 1020 Puget Dr
- 524 Maple St Unit 102
Ask me questions while you tour the home.