948 Wilbraham Rd Springfield, MA 01109
Sixteen Acres NeighborhoodEstimated Value: $203,000 - $277,000
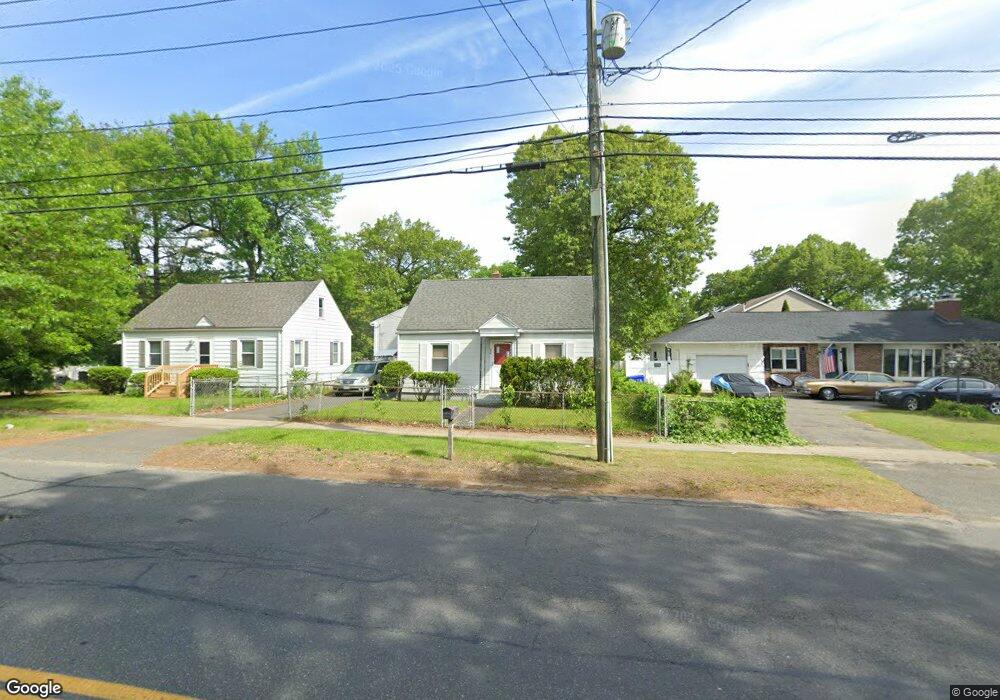
About This Home
This home is located at 948 Wilbraham Rd, Springfield, MA 01109 and is currently estimated at $236,815, approximately $274 per square foot. 948 Wilbraham Rd is a home located in Hampden County with nearby schools including Frank H. Freedman School, John J Duggan Middle, and Springfield High School of Science and Technology.
Ownership History
We collect this data history from publicly available records. To have your information removed, we recommend requesting removal directly through your county’s website.
Purchase Details
Home Financials for this Owner
Home Financials are based on the most recent Mortgage that was taken out on this home.Purchase Details
Home Values in the Area
Average Home Value in this Area
Purchase History
We collect this data history from publicly available records. To have your information removed, we recommend requesting removal directly through your county’s website.
| Date | Buyer | Sale Price | Title Company |
|---|---|---|---|
| $75,100 | -- | ||
| -- | -- |
Mortgage History
We collect this data history from publicly available records. To have your information removed, we recommend requesting removal directly through your county’s website.
| Date | Status | Borrower | Loan Amount |
|---|---|---|---|
| Open | $52,847 |
Tax History
We collect this data history from publicly available records. To have your information removed, we recommend requesting removal directly through your county’s website.
| Year | Tax Paid | Tax Assessment Tax Assessment Total Assessment is a certain percentage of the fair market value that is determined by local assessors to be the total taxable value of land and additions on the property. | Land | Improvement |
|---|---|---|---|---|
| 2025 | $3,081 | $196,500 | $50,900 | $145,600 |
| 2024 | $2,791 | $173,800 | $50,900 | $122,900 |
| 2023 | $2,774 | $162,700 | $48,400 | $114,300 |
| 2022 | $2,657 | $141,200 | $48,400 | $92,800 |
| 2021 | $2,591 | $137,100 | $44,000 | $93,100 |
| 2020 | $2,492 | $127,600 | $44,000 | $83,600 |
| 2019 | $2,310 | $117,400 | $44,000 | $73,400 |
| 2018 | $2,393 | $121,600 | $44,000 | $77,600 |
| 2017 | $2,426 | $123,400 | $48,500 | $74,900 |
| 2016 | $2,212 | $112,500 | $48,500 | $64,000 |
| 2015 | $2,272 | $115,500 | $48,500 | $67,000 |
Map
- 974 Wilbraham Rd
- 865 Wilbraham Rd
- 15 Monticello Ave
- 168 Keddy St
- 157 Penrose St
- 306 Greenaway Dr
- 189 Seymour Ave
- 289 Morton St
- 291 Old Farm Rd
- 35 Lemnos Ln
- 545-547 Wilbraham Rd
- 746-748 Alden St
- 5 Barber St
- 915 Bradley Rd
- 111 Breckwood Blvd
- 34 Preston St
- 19 Wilton St
- 14 Duggan Cir
- 854 Grayson Dr
- 44 Maebeth St
Ask me questions while you tour the home.