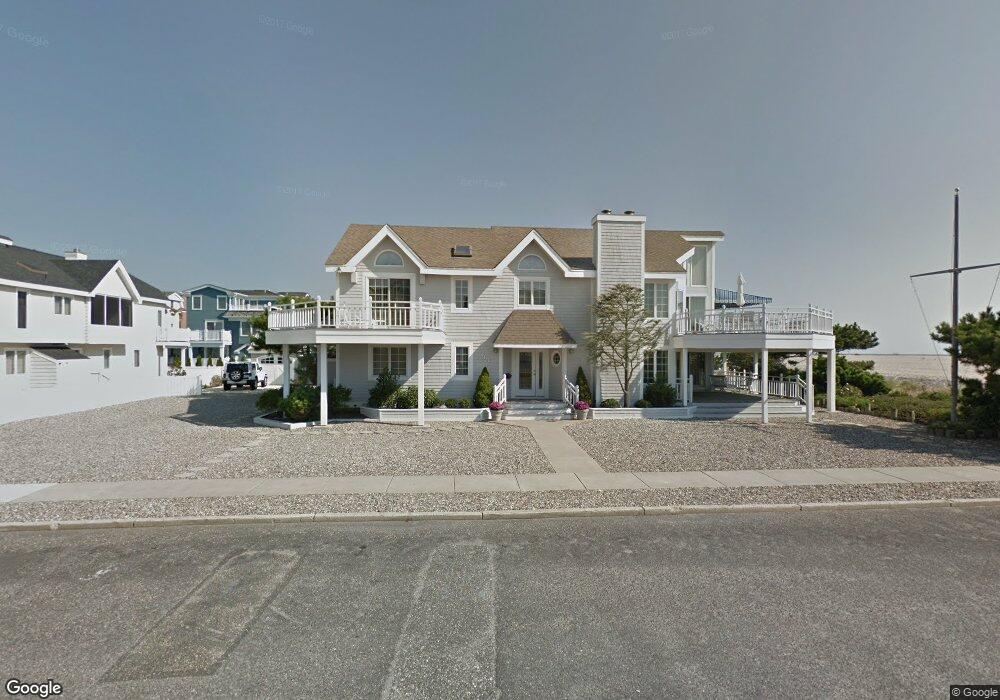
95 19th St E Avalon, NJ 08202
Estimated Value: $5,646,000 - $7,857,000
Studio
--
Bath
4,609
Sq Ft
$1,431/Sq Ft
Est. Value
About This Home
This home is located at 95 19th St E, Avalon, NJ 08202 and is currently estimated at $6,597,075, approximately $1,431 per square foot. 95 19th St E is a home with nearby schools including Avalon Elementary School.
Ownership History
Date
Name
Owned For
Owner Type
Purchase Details
Closed on
Jul 14, 2017
Sold by
Roberts Helen N
Bought by
Roberts Gregory B and Roberts Helen N
Current Estimated Value
Purchase Details
Closed on
Jul 31, 2006
Sold by
Roberts Gregory B and Roberts Helen N
Bought by
Roberts Helen N
Purchase Details
Closed on
Sep 27, 2005
Sold by
Larkin C Raymond and Larkin Mary Ann
Bought by
Roberts Gregory B and Roberts Helen H
Create a Home Valuation Report for This Property
The Home Valuation Report is an in-depth analysis detailing your home's value as well as a comparison with similar homes in the area
Home Values in the Area
Average Home Value in this Area
Purchase History
| Date | Buyer | Sale Price | Title Company |
|---|---|---|---|
| Roberts Gregory B | -- | None Available | |
| Roberts Helen N | -- | Seaboard Title | |
| Roberts Gregory B | $3,600,000 | -- |
Source: Public Records
Tax History
| Year | Tax Paid | Tax Assessment Tax Assessment Total Assessment is a certain percentage of the fair market value that is determined by local assessors to be the total taxable value of land and additions on the property. | Land | Improvement |
|---|---|---|---|---|
| 2025 | $31,397 | $5,113,500 | $3,807,300 | $1,306,200 |
| 2024 | $31,397 | $5,113,500 | $3,807,300 | $1,306,200 |
| 2023 | $31,141 | $5,113,500 | $3,807,300 | $1,306,200 |
| 2022 | $29,045 | $5,113,500 | $3,807,300 | $1,306,200 |
| 2021 | $27,971 | $5,113,500 | $3,807,300 | $1,306,200 |
| 2020 | $26,897 | $5,113,500 | $3,807,300 | $1,306,200 |
| 2019 | $26,079 | $5,113,500 | $3,807,300 | $1,306,200 |
| 2018 | $24,954 | $5,113,500 | $3,807,300 | $1,306,200 |
| 2017 | $23,169 | $4,167,100 | $3,163,100 | $1,004,000 |
| 2016 | $22,919 | $4,167,100 | $3,163,100 | $1,004,000 |
| 2015 | $22,544 | $4,167,100 | $3,163,100 | $1,004,000 |
| 2014 | $22,294 | $4,167,100 | $3,163,100 | $1,004,000 |
Source: Public Records
Map
Nearby Homes
Your Personal Tour Guide
Ask me questions while you tour the home.