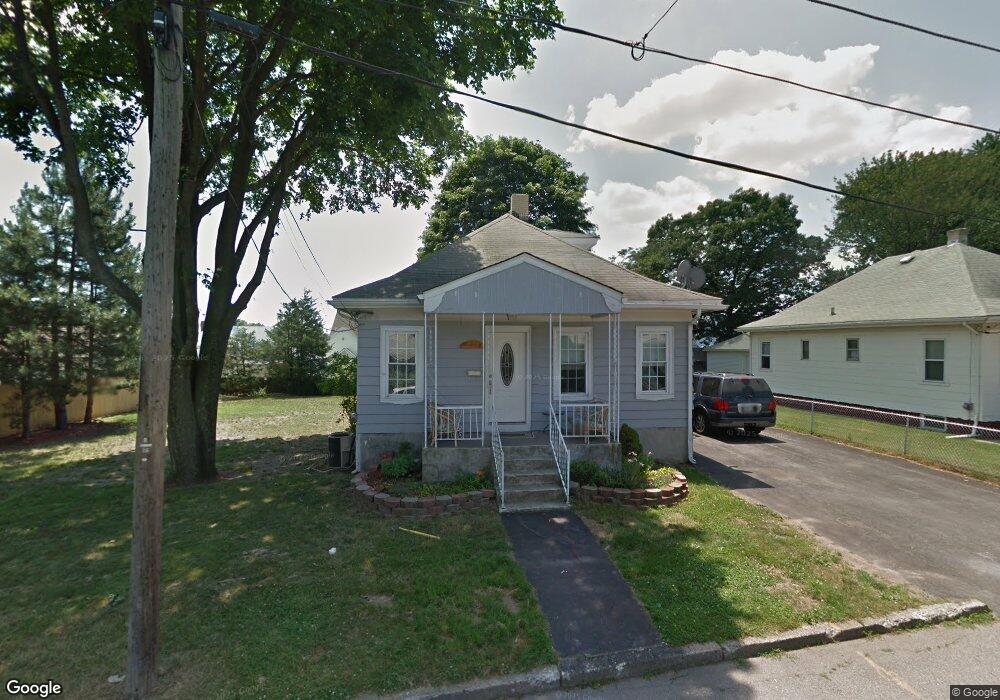
95 Boyce Ave Pawtucket, RI 02861
Darlington NeighborhoodEstimated Value: $381,000 - $410,000
3
Beds
1
Bath
1,172
Sq Ft
$333/Sq Ft
Est. Value
About This Home
This home is located at 95 Boyce Ave, Pawtucket, RI 02861 and is currently estimated at $389,899, approximately $332 per square foot. 95 Boyce Ave is a home located in Providence County with nearby schools including Saint Teresa Catholic Elementary School, St Cecilia School, and Saint Raphael Academy.
Ownership History
Date
Name
Owned For
Owner Type
Purchase Details
Closed on
Oct 17, 2025
Sold by
Sotiro-Poulos Geraldine E
Bought by
Cooper Samuel and Cooper Brandon L
Current Estimated Value
Purchase Details
Closed on
Feb 5, 2015
Sold by
Casey Realty and Pawtucket City Of
Bought by
Cooper Brandee L
Purchase Details
Closed on
Oct 27, 2000
Sold by
Metivier Edward R
Bought by
Erickson Gustav and Austin Wendy
Create a Home Valuation Report for This Property
The Home Valuation Report is an in-depth analysis detailing your home's value as well as a comparison with similar homes in the area
Home Values in the Area
Average Home Value in this Area
Purchase History
| Date | Buyer | Sale Price | Title Company |
|---|---|---|---|
| Cooper Samuel | -- | -- | |
| Cooper Brandee L | $1,371 | -- | |
| Erickson Gustav | $121,000 | -- |
Source: Public Records
Mortgage History
| Date | Status | Borrower | Loan Amount |
|---|---|---|---|
| Previous Owner | Erickson Gustav | $165,000 | |
| Previous Owner | Erickson Gustav | $148,500 | |
| Previous Owner | Erickson Gustav | $132,000 | |
| Previous Owner | Erickson Gustav | $80,200 |
Source: Public Records
Tax History
| Year | Tax Paid | Tax Assessment Tax Assessment Total Assessment is a certain percentage of the fair market value that is determined by local assessors to be the total taxable value of land and additions on the property. | Land | Improvement |
|---|---|---|---|---|
| 2025 | $3,249 | $247,100 | $97,700 | $149,400 |
| 2024 | $3,049 | $247,100 | $97,700 | $149,400 |
| 2023 | $3,427 | $202,300 | $84,700 | $117,600 |
| 2022 | $3,354 | $202,300 | $84,700 | $117,600 |
| 2021 | $3,354 | $202,300 | $84,700 | $117,600 |
| 2020 | $3,175 | $152,000 | $72,400 | $79,600 |
| 2019 | $3,175 | $152,000 | $72,400 | $79,600 |
| 2018 | $3,060 | $152,000 | $72,400 | $79,600 |
| 2017 | $2,717 | $119,600 | $57,600 | $62,000 |
| 2016 | $2,618 | $119,600 | $57,600 | $62,000 |
| 2015 | $2,618 | $119,600 | $57,600 | $62,000 |
| 2014 | $2,829 | $122,700 | $64,000 | $58,700 |
Source: Public Records
Map
Nearby Homes
Your Personal Tour Guide
Ask me questions while you tour the home.